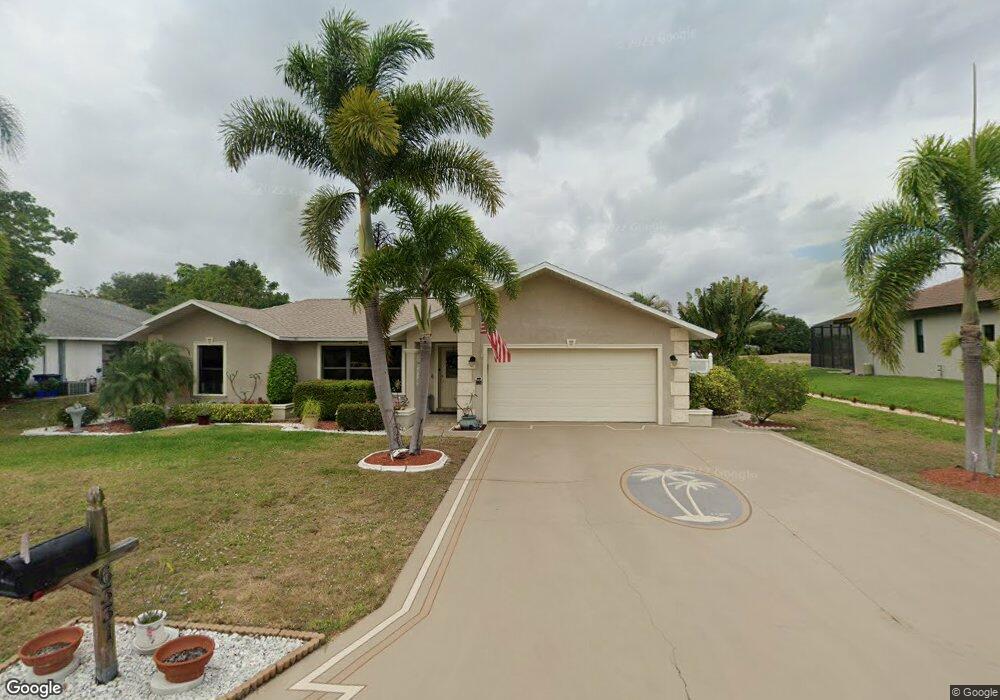
6337 P G A Dr North Fort Myers, FL 33917
Estimated Value: $311,654 - $368,000
3
Beds
2
Baths
2,580
Sq Ft
$129/Sq Ft
Est. Value
About This Home
This home is located at 6337 P G A Dr, North Fort Myers, FL 33917 and is currently estimated at $333,414, approximately $129 per square foot. 6337 P G A Dr is a home located in Lee County with nearby schools including Bayshore Elementary School, Orange River Elementary School, and Tice Elementary School.
Ownership History
Date
Name
Owned For
Owner Type
Purchase Details
Closed on
Dec 23, 2010
Sold by
Aurora Loan Services Llc
Bought by
Gunzenhauser Glenn W and Gunzenhauser Dorothy D
Current Estimated Value
Purchase Details
Closed on
Sep 14, 2010
Sold by
Vawter George R and Vawter George
Bought by
Aurora Loan Services Llc
Purchase Details
Closed on
Aug 31, 2005
Sold by
Zartman George and Zartman Jo Ann
Bought by
Vawter George R and Vawter Freida R
Home Financials for this Owner
Home Financials are based on the most recent Mortgage that was taken out on this home.
Original Mortgage
$220,000
Interest Rate
6.37%
Mortgage Type
Unknown
Purchase Details
Closed on
Sep 23, 1994
Sold by
Gebahi Nabil and Gebahi Alba
Bought by
Zartman George and Zartman Jo Ann
Home Financials for this Owner
Home Financials are based on the most recent Mortgage that was taken out on this home.
Original Mortgage
$103,500
Interest Rate
8.62%
Create a Home Valuation Report for This Property
The Home Valuation Report is an in-depth analysis detailing your home's value as well as a comparison with similar homes in the area
Home Values in the Area
Average Home Value in this Area
Purchase History
| Date | Buyer | Sale Price | Title Company |
|---|---|---|---|
| Gunzenhauser Glenn W | $100,000 | Landcastle Title Llc | |
| Aurora Loan Services Llc | -- | None Available | |
| Vawter George R | $275,000 | -- | |
| Zartman George | $109,000 | -- |
Source: Public Records
Mortgage History
| Date | Status | Borrower | Loan Amount |
|---|---|---|---|
| Previous Owner | Vawter George R | $220,000 | |
| Previous Owner | Zartman George | $103,500 |
Source: Public Records
Tax History Compared to Growth
Tax History
| Year | Tax Paid | Tax Assessment Tax Assessment Total Assessment is a certain percentage of the fair market value that is determined by local assessors to be the total taxable value of land and additions on the property. | Land | Improvement |
|---|---|---|---|---|
| 2025 | $1,693 | $138,647 | -- | -- |
| 2024 | $1,636 | $134,740 | -- | -- |
| 2023 | $1,636 | $130,816 | $0 | $0 |
| 2022 | $1,779 | $127,006 | $0 | $0 |
| 2021 | $1,715 | $198,419 | $50,760 | $147,659 |
| 2020 | $1,714 | $121,605 | $0 | $0 |
| 2019 | $1,671 | $118,871 | $0 | $0 |
| 2018 | $1,661 | $116,655 | $0 | $0 |
| 2017 | $1,649 | $114,256 | $0 | $0 |
| 2016 | $1,512 | $172,012 | $21,114 | $150,898 |
| 2015 | $1,524 | $149,201 | $20,304 | $128,897 |
| 2014 | $1,503 | $136,513 | $20,304 | $116,209 |
| 2013 | -- | $114,300 | $19,386 | $94,914 |
Source: Public Records
Map
Nearby Homes
- 6340 P G A Dr
- 15188 Sam Snead Ln
- 6419 Ben Hogan Cir
- 15192 Riverbend Blvd
- 15180 Riverbend Blvd Unit 305
- 15320 Moonraker Ct Unit 206
- 15160 Riverbend Blvd Unit 406
- 15160 Riverbend Blvd Unit 403
- 15350 Moonraker Ct Unit 304
- 15138 Sam Snead Ln
- 6414 Ben Hogan Cir
- 15430 Moonraker Ct Unit 502
- 6471 P G A Dr
- 15250 Riverbend Blvd Unit 101
- 15444 Admiralty Cir Unit 4
- 1832 Flamingo Dr
- 15472 Nelsons Walk Ct
- 15256 Riverbend Blvd Unit 204
- 15256 Riverbend Blvd Unit 105
- 15489 Admiralty Cir Unit 3
- 6341 P G A Dr
- 6311 P G A Dr
- 6330 P G A Dr
- 6320 P G A Dr
- 6310 P G A Dr
- 15220 Sam Snead Ln
- 15230 Sam Snead Ln
- 15210 Sam Snead Ln
- 6350 P G A Dr
- 15198 Sam Snead Ln
- 15240 Sam Snead Ln
- 6300 P G A Dr
- 15350 Sam Snead Ln
- 6360 P G A Dr
- 6371 P G A Dr
- 15250 Sam Snead Ln
- 15221 Sam Snead Ln
- 15231 Sam Snead Ln
- 15211 Sam Snead Ln
- 6451 River Club Ct