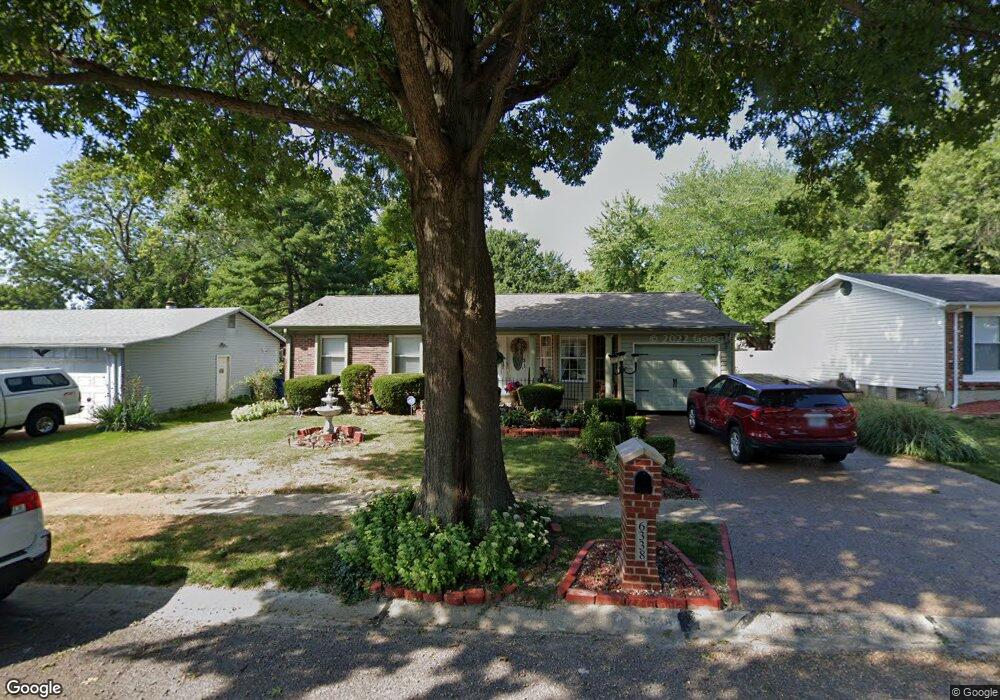
6338 Coventry Dr Florissant, MO 63033
Estimated Value: $170,612 - $194,000
3
Beds
2
Baths
1,180
Sq Ft
$153/Sq Ft
Est. Value
About This Home
This home is located at 6338 Coventry Dr, Florissant, MO 63033 and is currently estimated at $180,653, approximately $153 per square foot. 6338 Coventry Dr is a home located in St. Louis County with nearby schools including Townsend Elementary School, Central Middle School, and Hazelwood Central High School.
Ownership History
Date
Name
Owned For
Owner Type
Purchase Details
Closed on
Feb 4, 2022
Sold by
Charese Payne
Bought by
Payne Charese
Current Estimated Value
Home Financials for this Owner
Home Financials are based on the most recent Mortgage that was taken out on this home.
Original Mortgage
$115,500
Outstanding Balance
$93,211
Interest Rate
3.55%
Mortgage Type
New Conventional
Estimated Equity
$87,442
Purchase Details
Closed on
Oct 20, 2015
Sold by
Davis Charese and Payne Charese Davis
Bought by
Davis Charese
Home Financials for this Owner
Home Financials are based on the most recent Mortgage that was taken out on this home.
Original Mortgage
$126,734
Interest Rate
4.4%
Mortgage Type
FHA
Purchase Details
Closed on
Oct 2, 2015
Sold by
Payne William Edward
Bought by
Davis Charese and Payne Charese Davis
Home Financials for this Owner
Home Financials are based on the most recent Mortgage that was taken out on this home.
Original Mortgage
$126,734
Interest Rate
4.4%
Mortgage Type
FHA
Create a Home Valuation Report for This Property
The Home Valuation Report is an in-depth analysis detailing your home's value as well as a comparison with similar homes in the area
Home Values in the Area
Average Home Value in this Area
Purchase History
| Date | Buyer | Sale Price | Title Company |
|---|---|---|---|
| Payne Charese | -- | New Title Company Name | |
| Davis Charese | -- | Vision Title Llc E | |
| Davis Charese | -- | None Available |
Source: Public Records
Mortgage History
| Date | Status | Borrower | Loan Amount |
|---|---|---|---|
| Open | Payne Charese | $115,500 | |
| Previous Owner | Davis Charese | $126,734 |
Source: Public Records
Tax History Compared to Growth
Tax History
| Year | Tax Paid | Tax Assessment Tax Assessment Total Assessment is a certain percentage of the fair market value that is determined by local assessors to be the total taxable value of land and additions on the property. | Land | Improvement |
|---|---|---|---|---|
| 2025 | $2,407 | $30,210 | $3,570 | $26,640 |
| 2024 | $2,407 | $26,580 | $2,470 | $24,110 |
| 2023 | $2,399 | $26,580 | $2,470 | $24,110 |
| 2022 | $1,991 | $19,590 | $4,660 | $14,930 |
| 2021 | $1,885 | $19,590 | $4,660 | $14,930 |
| 2020 | $1,716 | $16,600 | $2,790 | $13,810 |
| 2019 | $1,703 | $16,600 | $2,790 | $13,810 |
| 2018 | $1,639 | $14,760 | $1,670 | $13,090 |
| 2017 | $1,637 | $14,760 | $1,670 | $13,090 |
| 2016 | $1,822 | $16,190 | $2,430 | $13,760 |
| 2015 | $1,780 | $16,190 | $2,430 | $13,760 |
| 2014 | $1,920 | $17,400 | $2,850 | $14,550 |
Source: Public Records
Map
Nearby Homes
- 12065 El Camara Dr
- 12095 El Camara Dr
- 12136 La Padera Ln
- 6250 Pennyrich Ct
- 11760 Sheffield Dr
- 11774 El Somo Ct
- 6530 Farm Pond Ct
- 12320 Missile Ln
- 11951 Jerries Ln
- 12292 Jerries Ln
- 5432 Trailbend Dr
- 6480 Hadden Bay Dr
- 5348 Trailoaks Dr
- 11757 Vizcuya Ct
- 12455 Jerries Ln
- 6320 Hadden Bay Dr
- 5372 Trailbend Dr
- 5239 Trailoaks Dr
- 11440 Sheffield Dr
- 6587 Dolphin Cir E Unit 110B
- 6328 Coventry Dr
- 6348 Coventry Dr
- 6318 Coventry Dr
- 6354 Coventry Dr
- 12072 El Camara Dr
- 12066 El Camara Dr
- 12060 El Camara Dr
- 6337 Coventry Dr
- 12078 El Camara Dr
- 6345 Coventry Dr
- 12054 El Camara Dr
- 6351 Coventry Dr
- 6327 Coventry Dr
- 6308 Coventry Dr
- 6357 Coventry Dr
- 12048 El Camara Dr
- 6321 Coventry Dr
- 6315 Coventry Dr
- 12113 La Padera Ln
- 6309 Coventry Dr