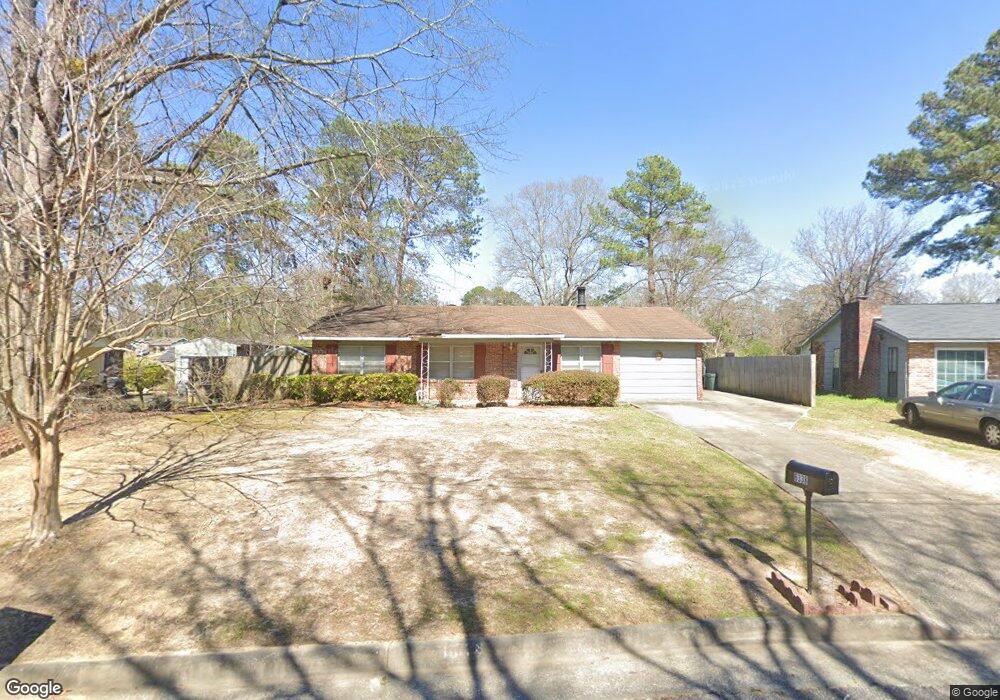
6338 Rockefeller Dr Columbus, GA 31909
North Columbus NeighborhoodEstimated Value: $193,000 - $233,000
3
Beds
2
Baths
1,303
Sq Ft
$159/Sq Ft
Est. Value
About This Home
This home is located at 6338 Rockefeller Dr, Columbus, GA 31909 and is currently estimated at $207,121, approximately $158 per square foot. 6338 Rockefeller Dr is a home located in Muscogee County with nearby schools including Midland Academy, Midland Middle School, and Shaw High School.
Ownership History
Date
Name
Owned For
Owner Type
Purchase Details
Closed on
Nov 30, 2011
Sold by
Sec Of Veterans Affa
Bought by
Holman Pamela M
Current Estimated Value
Home Financials for this Owner
Home Financials are based on the most recent Mortgage that was taken out on this home.
Original Mortgage
$78,848
Outstanding Balance
$55,823
Interest Rate
4.25%
Mortgage Type
FHA
Estimated Equity
$151,298
Purchase Details
Closed on
Aug 2, 2011
Sold by
Phh Mtg Corp
Bought by
Sec Of Veterans Affairs
Purchase Details
Closed on
Nov 24, 2008
Sold by
Patton James R
Bought by
Patton James R and Patton Beatriz C
Home Financials for this Owner
Home Financials are based on the most recent Mortgage that was taken out on this home.
Original Mortgage
$153,100
Interest Rate
6.51%
Mortgage Type
VA
Create a Home Valuation Report for This Property
The Home Valuation Report is an in-depth analysis detailing your home's value as well as a comparison with similar homes in the area
Home Values in the Area
Average Home Value in this Area
Purchase History
| Date | Buyer | Sale Price | Title Company |
|---|---|---|---|
| Holman Pamela M | $80,900 | -- | |
| Sec Of Veterans Affairs | $88,130 | -- | |
| Phh Mtg Corp | $88,130 | -- | |
| Patton James R | -- | None Available | |
| Patton James R | $149,900 | None Available |
Source: Public Records
Mortgage History
| Date | Status | Borrower | Loan Amount |
|---|---|---|---|
| Open | Holman Pamela M | $78,848 | |
| Previous Owner | Patton James R | $153,100 |
Source: Public Records
Tax History
| Year | Tax Paid | Tax Assessment Tax Assessment Total Assessment is a certain percentage of the fair market value that is determined by local assessors to be the total taxable value of land and additions on the property. | Land | Improvement |
|---|---|---|---|---|
| 2025 | $751 | $79,872 | $9,512 | $70,360 |
| 2024 | $749 | $79,872 | $9,512 | $70,360 |
| 2023 | $60 | $79,872 | $9,512 | $70,360 |
| 2022 | $781 | $62,568 | $9,512 | $53,056 |
| 2021 | $775 | $52,480 | $9,512 | $42,968 |
| 2020 | $775 | $52,480 | $9,512 | $42,968 |
| 2019 | $2,150 | $52,480 | $9,512 | $42,968 |
| 2018 | $2,150 | $52,480 | $9,512 | $42,968 |
| 2017 | $783 | $52,480 | $9,512 | $42,968 |
| 2016 | $787 | $60,161 | $5,316 | $54,845 |
| 2015 | $790 | $60,161 | $5,316 | $54,845 |
| 2014 | $793 | $60,161 | $5,316 | $54,845 |
| 2013 | -- | $60,161 | $5,316 | $54,845 |
Source: Public Records
Map
Nearby Homes
- 6502 Tidewater Ct
- 6528 Yellow Stone Ct
- 6100 Stony Creek Dr
- 5258 Cunningham Dr
- 5912 Big Oak Dr
- 4017 Shade Valley Dr
- 5045 Old Post Rd
- 5042 Foxfire Dr
- 5041 Montego Dr
- 7101 Cross Tie Dr
- 4826 Teak Dr
- 6421 Lemans Ln
- 4802 Basswood Dr
- 6016 Warm Springs Ct
- 2991 Slippery Rock Ct
- 9020 Scottsdale Ct
- 9028 Scottsdale Ct
- 4627 Wimbish Ct
- 4618 Thoroughbred Ln
- 7389 Sorrel Ct
- 6332 Rockefeller Dr
- 6346 Rockefeller Dr
- 6329 Goodwin Dr
- 6323 Goodwin Dr
- 6337 Goodwin Dr
- 6324 Rockefeller Dr
- 6315 Goodwin Dr
- 6621 Rockefeller Dr
- 6333 Rockefeller Dr
- 6345 Rockefeller Dr
- 6307 Goodwin Dr
- 6318 Rockefeller Dr
- 6323 Rockefeller Dr
- 6301 Goodwin Dr
- 5641 Jamestown Dr
- 5635 Jamestown Dr
- 5647 Jamestown Dr
- 5629 Jamestown Dr
- 5616 Jamestown Dr
- 6245 Goodwin Dr
Your Personal Tour Guide
Ask me questions while you tour the home.