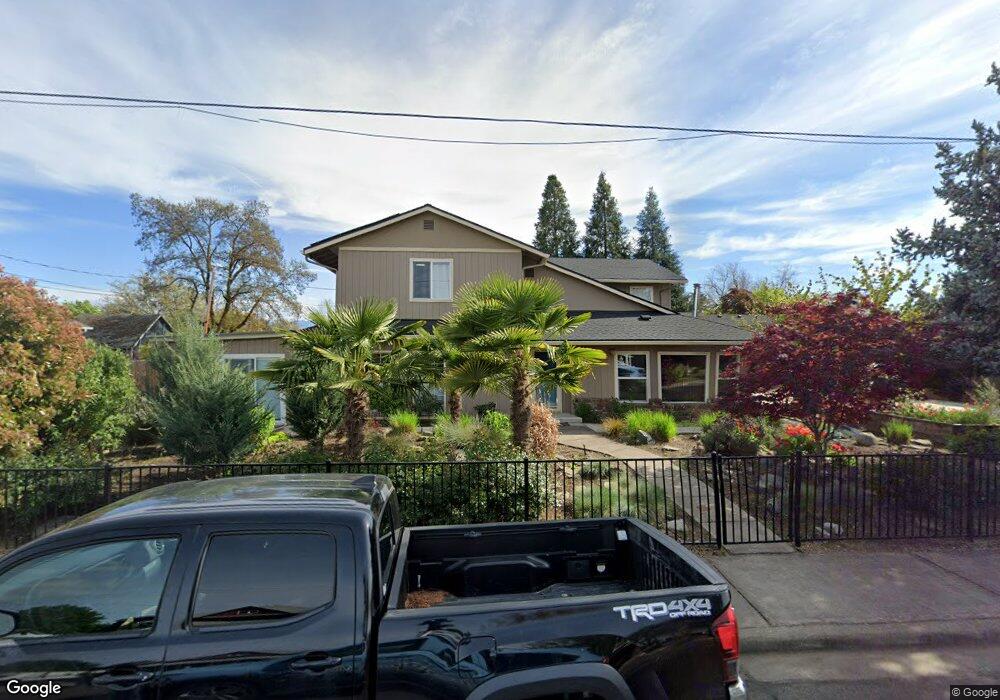
634 Cedar St Central Point, OR 97502
Estimated Value: $484,000 - $666,584
3
Beds
3
Baths
2,703
Sq Ft
$221/Sq Ft
Est. Value
About This Home
This home is located at 634 Cedar St, Central Point, OR 97502 and is currently estimated at $598,396, approximately $221 per square foot. 634 Cedar St is a home located in Jackson County with nearby schools including Central Point Elementary School, Scenic Middle School, and Crater High School.
Ownership History
Date
Name
Owned For
Owner Type
Purchase Details
Closed on
Sep 26, 2023
Sold by
Charles Jeffery Roady and Charles Jessica Graham
Bought by
Mesa Christopher and Miller Jacob
Current Estimated Value
Home Financials for this Owner
Home Financials are based on the most recent Mortgage that was taken out on this home.
Original Mortgage
$540,000
Outstanding Balance
$449,414
Interest Rate
7.09%
Mortgage Type
New Conventional
Estimated Equity
$148,982
Purchase Details
Closed on
Nov 6, 2019
Sold by
Roady Charles and Roady Jessica
Bought by
Roady Charles Jeffery and Roady Jessica Graham
Purchase Details
Closed on
Mar 13, 2019
Sold by
Roady Charles
Bought by
Roady Charles and Roady Jessica
Purchase Details
Closed on
Apr 7, 2016
Sold by
Roady Charles and Roady Jessica
Bought by
Roady Charles
Purchase Details
Closed on
Nov 30, 2015
Sold by
Roady Charles
Bought by
Roady Charles and Roady Jessica
Purchase Details
Closed on
Jun 20, 2008
Sold by
Wells Fargo Bank Na
Bought by
Roady Charles
Home Financials for this Owner
Home Financials are based on the most recent Mortgage that was taken out on this home.
Original Mortgage
$232,200
Interest Rate
6.07%
Mortgage Type
Purchase Money Mortgage
Purchase Details
Closed on
Dec 13, 2007
Sold by
Dennington Bonnie Lee
Bought by
Dlj Mortgage Capital Inc
Purchase Details
Closed on
Nov 22, 2006
Sold by
Dennington Bonnie Lee
Bought by
Dennington Bonnie Lee
Home Financials for this Owner
Home Financials are based on the most recent Mortgage that was taken out on this home.
Original Mortgage
$164,700
Interest Rate
6.37%
Mortgage Type
New Conventional
Purchase Details
Closed on
Jun 2, 1999
Sold by
Durham John T and Durham Roxene L
Bought by
Dennington Bonnie L and Dennington Herman R
Home Financials for this Owner
Home Financials are based on the most recent Mortgage that was taken out on this home.
Original Mortgage
$135,000
Interest Rate
7.01%
Create a Home Valuation Report for This Property
The Home Valuation Report is an in-depth analysis detailing your home's value as well as a comparison with similar homes in the area
Purchase History
| Date | Buyer | Sale Price | Title Company |
|---|---|---|---|
| Mesa Christopher | $680,000 | Ticor Title | |
| Roady Charles Jeffery | -- | None Available | |
| Roady Charles | -- | None Available | |
| Roady Charles | -- | None Available | |
| Roady Charles | -- | None Available | |
| Roady Charles | $258,000 | First American | |
| Dlj Mortgage Capital Inc | $43,082 | None Available | |
| Dennington Bonnie Lee | -- | Ticor Title | |
| Dennington Bonnie L | $150,000 | Key Title Company |
Source: Public Records
Mortgage History
| Date | Status | Borrower | Loan Amount |
|---|---|---|---|
| Open | Mesa Christopher | $540,000 | |
| Previous Owner | Roady Charles | $232,200 | |
| Previous Owner | Dennington Bonnie Lee | $164,700 | |
| Previous Owner | Dennington Bonnie L | $135,000 |
Source: Public Records
Tax History
| Year | Tax Paid | Tax Assessment Tax Assessment Total Assessment is a certain percentage of the fair market value that is determined by local assessors to be the total taxable value of land and additions on the property. | Land | Improvement |
|---|---|---|---|---|
| 2026 | $6,732 | $406,820 | -- | -- |
| 2025 | $6,567 | $394,980 | $78,130 | $316,850 |
| 2024 | $6,567 | $383,480 | $75,860 | $307,620 |
| 2023 | $6,356 | $372,320 | $73,650 | $298,670 |
| 2022 | $6,207 | $372,320 | $73,650 | $298,670 |
| 2021 | $6,030 | $361,480 | $71,510 | $289,970 |
| 2020 | $4,626 | $277,300 | $69,430 | $207,870 |
| 2019 | $4,511 | $261,390 | $65,450 | $195,940 |
| 2018 | $4,374 | $253,780 | $63,540 | $190,240 |
| 2017 | $4,264 | $253,780 | $63,540 | $190,240 |
| 2016 | $4,140 | $239,220 | $59,890 | $179,330 |
| 2015 | $3,966 | $239,220 | $59,890 | $179,330 |
| 2014 | $3,865 | $225,500 | $56,450 | $169,050 |
Source: Public Records
Map
Nearby Homes
- 555 Freeman Rd Unit 73
- 555 Freeman Rd Unit 254
- 555 Freeman Rd Unit 105
- 555 Freeman Rd Unit 209
- 350 Alder St
- 220 S 3rd St
- 301 Freeman Rd Unit 30
- 301 Freeman Rd Unit 92
- 301 Freeman Rd Unit 91
- 114 Cedar St
- 755 S 4th St
- 736 Hemlock Ave
- 144 N 5th St
- 230 Peninger Rd
- 185 Logan Ave
- 436 Cheney Loop
- 731 Maple St
- 533 Brittni Ln
- 331 N 8th St
- 3364 Bursell Rd
Your Personal Tour Guide
Ask me questions while you tour the home.