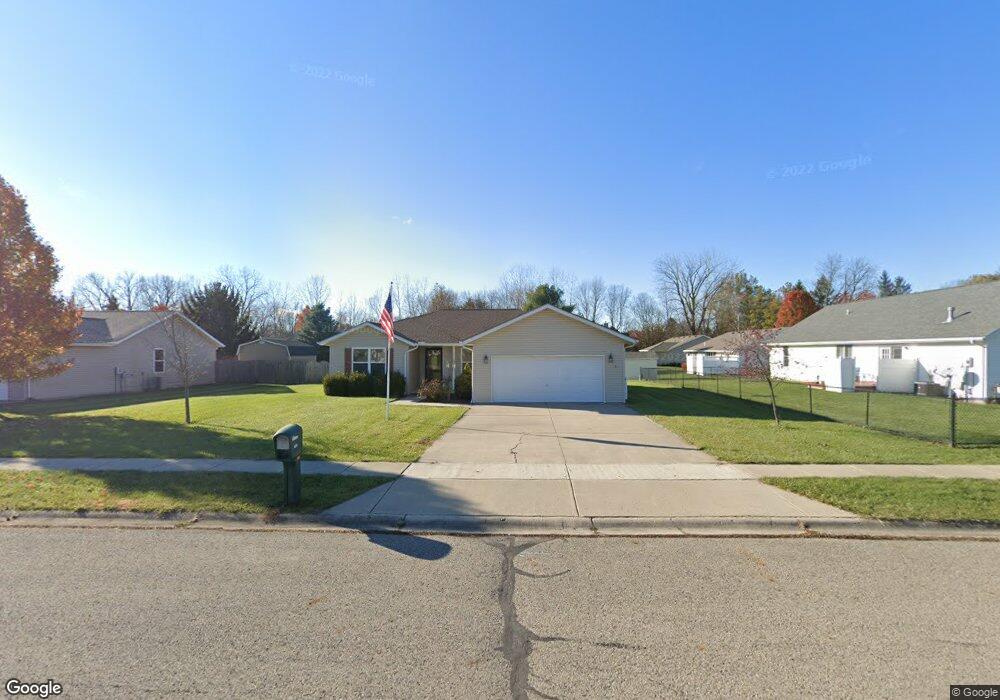
634 Dorothy Moore Ave Urbana, OH 43078
Estimated Value: $251,662 - $282,000
3
Beds
2
Baths
1,385
Sq Ft
$191/Sq Ft
Est. Value
About This Home
This home is located at 634 Dorothy Moore Ave, Urbana, OH 43078 and is currently estimated at $264,916, approximately $191 per square foot. 634 Dorothy Moore Ave is a home located in Champaign County with nearby schools including Urbana Elementary School, Urbana High School, and Urbana Community School.
Ownership History
Date
Name
Owned For
Owner Type
Purchase Details
Closed on
Jan 5, 2007
Sold by
Walter J Daniel and Walter Cheryl L
Bought by
Mcintosh Dennis L
Current Estimated Value
Purchase Details
Closed on
Apr 27, 2004
Sold by
Puppy Love Inc
Bought by
Walter J Harriet and Walter Daniel J
Purchase Details
Closed on
Nov 13, 2003
Sold by
Wooten Kenneth
Bought by
Puppy Love Inc
Home Financials for this Owner
Home Financials are based on the most recent Mortgage that was taken out on this home.
Original Mortgage
$92,000
Interest Rate
5.81%
Mortgage Type
Construction
Purchase Details
Closed on
Nov 4, 2003
Sold by
Moores Excavating Inc
Bought by
Wooten Kenneth
Home Financials for this Owner
Home Financials are based on the most recent Mortgage that was taken out on this home.
Original Mortgage
$92,000
Interest Rate
5.81%
Mortgage Type
Construction
Create a Home Valuation Report for This Property
The Home Valuation Report is an in-depth analysis detailing your home's value as well as a comparison with similar homes in the area
Home Values in the Area
Average Home Value in this Area
Purchase History
| Date | Buyer | Sale Price | Title Company |
|---|---|---|---|
| Mcintosh Dennis L | $129,500 | Attorney | |
| Walter J Harriet | $124,900 | -- | |
| Puppy Love Inc | $22,500 | -- | |
| Wooten Kenneth | $67,500 | -- |
Source: Public Records
Mortgage History
| Date | Status | Borrower | Loan Amount |
|---|---|---|---|
| Previous Owner | Puppy Love Inc | $92,000 | |
| Previous Owner | Wooten Kenneth | $68,750 |
Source: Public Records
Tax History Compared to Growth
Tax History
| Year | Tax Paid | Tax Assessment Tax Assessment Total Assessment is a certain percentage of the fair market value that is determined by local assessors to be the total taxable value of land and additions on the property. | Land | Improvement |
|---|---|---|---|---|
| 2024 | $2,559 | $60,860 | $10,650 | $50,210 |
| 2023 | $2,559 | $60,860 | $10,650 | $50,210 |
| 2022 | $2,610 | $60,860 | $10,650 | $50,210 |
| 2021 | $2,286 | $47,210 | $8,520 | $38,690 |
| 2020 | $2,285 | $47,210 | $8,520 | $38,690 |
| 2019 | $2,258 | $47,210 | $8,520 | $38,690 |
| 2018 | $2,256 | $45,060 | $6,930 | $38,130 |
| 2017 | $2,241 | $45,060 | $6,930 | $38,130 |
| 2016 | $2,246 | $45,060 | $6,930 | $38,130 |
| 2015 | $2,222 | $43,240 | $6,930 | $36,310 |
| 2014 | $2,224 | $43,240 | $6,930 | $36,310 |
| 2013 | $1,900 | $43,240 | $6,930 | $36,310 |
Source: Public Records
Map
Nearby Homes
- 628 Dorothy Moore Ave
- 877 Boyce St
- 869 Boyce St
- 631 Dorothy Moore Ave
- 616 Dorothy Moore Ave
- 0 Boyce St
- 647 Dorothy Moore Ave
- 623 Dorothy Moore Ave
- 600 Dorothy Moore Ave Unit 12
- 600 Dorothy Moore Ave Unit 20
- 600 Dorothy Moore Ave Unit 16
- 600 Dorothy Moore Ave Unit 1
- 600 Dorothy Moore Ave Unit 10
- 600 Dorothy Moore Ave Unit 11
- 600 Dorothy Moore Ave Unit 9
- 600 Dorothy Moore Ave Unit 18
- 600 Dorothy Moore Ave Unit 6
- 600 Dorothy Moore Ave Unit 5
- 600 Dorothy Moore Ave Unit 14
- 600 Dorothy Moore Ave Unit 3