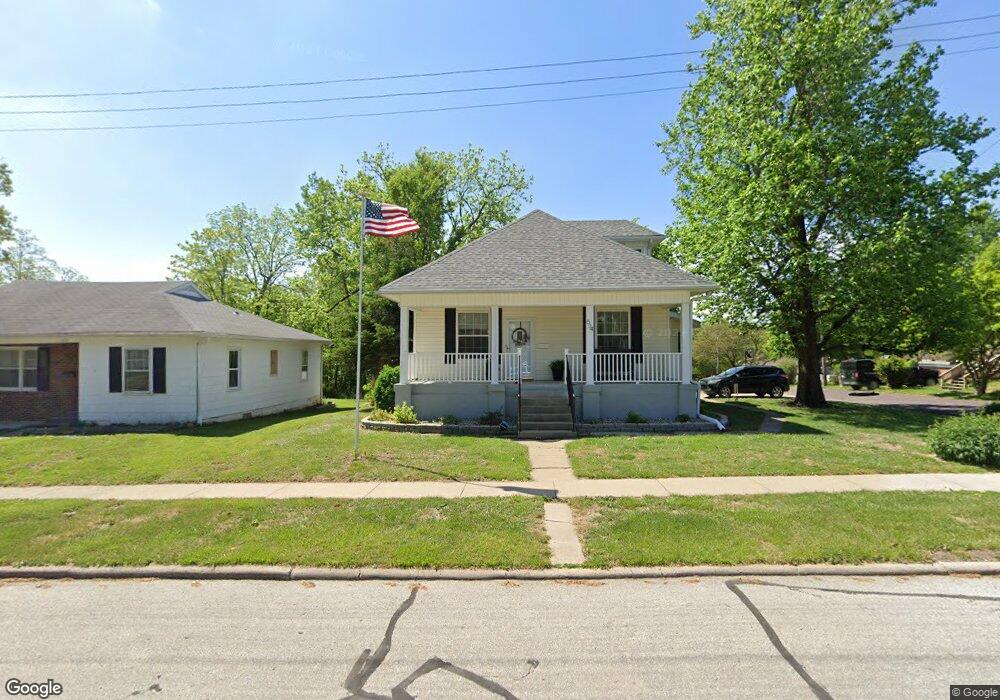
634 Gilman St Moberly, MO 65270
Estimated Value: $141,304 - $205,000
3
Beds
3
Baths
2,138
Sq Ft
$77/Sq Ft
Est. Value
About This Home
This home is located at 634 Gilman St, Moberly, MO 65270 and is currently estimated at $164,826, approximately $77 per square foot. 634 Gilman St is a home located in Randolph County with nearby schools including Moberly Senior High School, St. Pius X. Catholic School, and Maranatha Seventh-day Adventist School.
Ownership History
Date
Name
Owned For
Owner Type
Purchase Details
Closed on
Dec 18, 2020
Sold by
Lee Regina
Bought by
Myers Brooke A
Current Estimated Value
Home Financials for this Owner
Home Financials are based on the most recent Mortgage that was taken out on this home.
Original Mortgage
$78,000
Outstanding Balance
$69,443
Interest Rate
2.7%
Mortgage Type
New Conventional
Estimated Equity
$95,383
Purchase Details
Closed on
Oct 27, 2006
Sold by
Conway Julia
Bought by
Jackson Gwendolyn B
Create a Home Valuation Report for This Property
The Home Valuation Report is an in-depth analysis detailing your home's value as well as a comparison with similar homes in the area
Home Values in the Area
Average Home Value in this Area
Purchase History
| Date | Buyer | Sale Price | Title Company |
|---|---|---|---|
| Myers Brooke A | -- | None Available | |
| Jackson Gwendolyn B | -- | -- |
Source: Public Records
Mortgage History
| Date | Status | Borrower | Loan Amount |
|---|---|---|---|
| Open | Myers Brooke A | $78,000 |
Source: Public Records
Tax History Compared to Growth
Tax History
| Year | Tax Paid | Tax Assessment Tax Assessment Total Assessment is a certain percentage of the fair market value that is determined by local assessors to be the total taxable value of land and additions on the property. | Land | Improvement |
|---|---|---|---|---|
| 2025 | $568 | $8,540 | $1,201 | $7,339 |
| 2024 | $568 | $7,800 | $1,045 | $6,755 |
| 2023 | $577 | $7,800 | $1,045 | $6,755 |
| 2022 | $497 | $6,900 | $1,045 | $5,855 |
| 2021 | $497 | $6,900 | $1,045 | $5,855 |
| 2020 | $497 | $6,900 | $1,045 | $5,855 |
| 2019 | $495 | $6,900 | $1,045 | $5,855 |
| 2018 | $494 | $6,900 | $1,045 | $5,855 |
| 2017 | $493 | $6,900 | $0 | $0 |
| 2016 | $460 | $6,470 | $0 | $0 |
| 2014 | -- | $5,630 | $0 | $0 |
| 2013 | -- | $5,630 | $0 | $0 |
| 2012 | -- | $5,490 | $0 | $0 |
Source: Public Records
Map
Nearby Homes