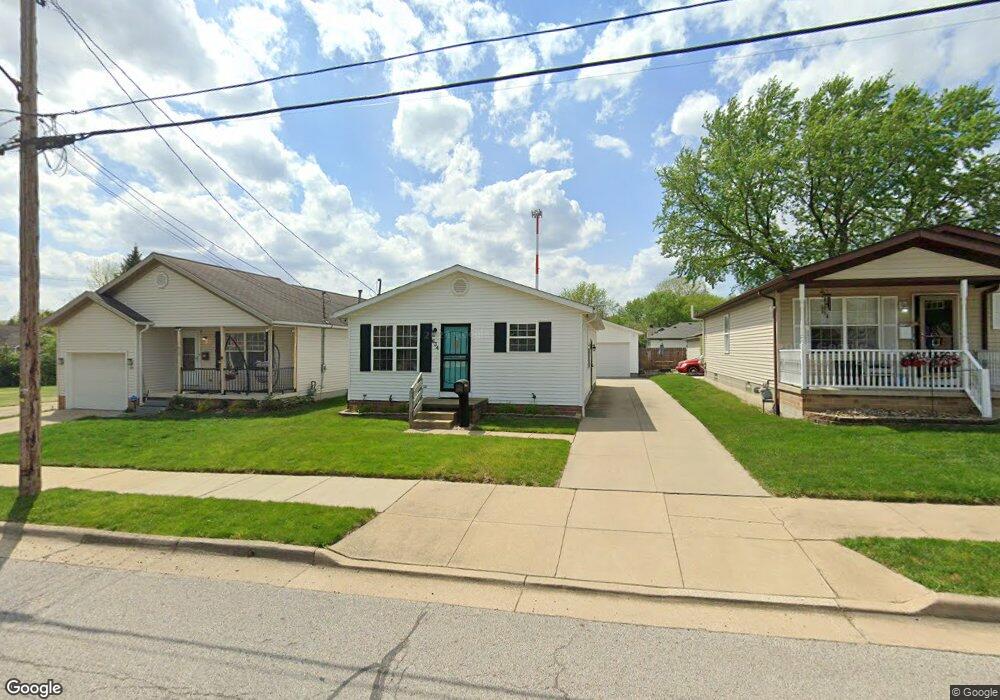
634 High Grove Blvd Akron, OH 44312
Ellet NeighborhoodEstimated Value: $159,000 - $200,000
3
Beds
2
Baths
960
Sq Ft
$182/Sq Ft
Est. Value
About This Home
This home is located at 634 High Grove Blvd, Akron, OH 44312 and is currently estimated at $174,499, approximately $181 per square foot. 634 High Grove Blvd is a home located in Summit County with nearby schools including Ellet High School, Summit Academy Akron Elementary School, and Hatton Community Learning Center.
Ownership History
Date
Name
Owned For
Owner Type
Purchase Details
Closed on
Feb 1, 2016
Sold by
Hall Roger W
Bought by
Perry Michael A and Perry Angel D
Current Estimated Value
Home Financials for this Owner
Home Financials are based on the most recent Mortgage that was taken out on this home.
Original Mortgage
$86,896
Outstanding Balance
$69,938
Interest Rate
4.25%
Mortgage Type
FHA
Estimated Equity
$104,561
Purchase Details
Closed on
Mar 2, 1999
Sold by
Benchmark Builders Inc
Bought by
Harvey Timothy S and Harvey Deanna J
Purchase Details
Closed on
Mar 20, 1998
Sold by
Benchmark Builders Inc
Bought by
Hall Roger W
Home Financials for this Owner
Home Financials are based on the most recent Mortgage that was taken out on this home.
Original Mortgage
$84,558
Interest Rate
7.14%
Mortgage Type
VA
Purchase Details
Closed on
May 28, 1997
Sold by
Creel Nancy J
Bought by
Benchmark Builders Inc
Purchase Details
Closed on
Jun 20, 1996
Sold by
Creel William
Bought by
Creel Violet
Create a Home Valuation Report for This Property
The Home Valuation Report is an in-depth analysis detailing your home's value as well as a comparison with similar homes in the area
Home Values in the Area
Average Home Value in this Area
Purchase History
| Date | Buyer | Sale Price | Title Company |
|---|---|---|---|
| Perry Michael A | $88,500 | First American Title | |
| Harvey Timothy S | -- | Midland Commerce Group | |
| Hall Roger W | $82,900 | -- | |
| Benchmark Builders Inc | $28,000 | -- | |
| Creel Violet | $103,000 | -- |
Source: Public Records
Mortgage History
| Date | Status | Borrower | Loan Amount |
|---|---|---|---|
| Open | Perry Michael A | $86,896 | |
| Previous Owner | Hall Roger W | $84,558 |
Source: Public Records
Tax History Compared to Growth
Tax History
| Year | Tax Paid | Tax Assessment Tax Assessment Total Assessment is a certain percentage of the fair market value that is determined by local assessors to be the total taxable value of land and additions on the property. | Land | Improvement |
|---|---|---|---|---|
| 2025 | $2,743 | $52,147 | $8,642 | $43,505 |
| 2024 | $2,743 | $52,147 | $8,642 | $43,505 |
| 2023 | $2,743 | $52,147 | $8,642 | $43,505 |
| 2022 | $2,454 | $36,544 | $5,919 | $30,625 |
| 2021 | $2,456 | $36,544 | $5,919 | $30,625 |
| 2020 | $2,419 | $36,550 | $5,920 | $30,630 |
| 2019 | $2,426 | $33,300 | $5,920 | $27,380 |
| 2018 | $2,393 | $33,300 | $5,920 | $27,380 |
| 2017 | $2,239 | $33,300 | $5,920 | $27,380 |
| 2016 | $2,241 | $30,590 | $5,920 | $24,670 |
| 2015 | $2,239 | $30,590 | $5,920 | $24,670 |
| 2014 | $2,221 | $30,590 | $5,920 | $24,670 |
| 2013 | $2,527 | $35,120 | $5,920 | $29,200 |
Source: Public Records
Map
Nearby Homes
- 544 Dennison Ave
- 905 1/2 Shadybrook Dr
- 490 Stevenson Ave
- 2487 Delaware Ave
- 379 Stull Ave
- 412 Stevenson Ave
- 440 Wirth Ave
- 1200 Abington Rd
- 307 Pauline Ave
- 2835 Farmdale Rd
- 2948 Trenton Rd
- 2528 Ogden Ave
- 423 Stetler Ave
- 2809 McElwain Rd
- 805 Utica Ave
- 880 Utica Ave
- 256 High Grove Blvd
- 0 Kreiner Ave
- 1357 Shanafelt Ave
- 2941 Old Home Rd
- 638 High Grove Blvd
- 630 High Grove Blvd
- 626 High Grove Blvd
- 642 High Grove Blvd
- 622 High Grove Blvd
- 671 Stevenson Ave
- 667 Stevenson Ave
- 641 High Grove Blvd
- 618 High Grove Blvd
- 631 High Grove Blvd
- 663 Stevenson Ave
- 623 High Grove Blvd
- 655 Stevenson Ave
- 612 High Grove Blvd
- 615 High Grove Blvd
- 2661 Rhoadesdale Ave
- 651 Stevenson Ave
- 2655 2657 Rhoadesdale Ave
- 2655 Rhoadesdale Ave
- 2655 Rhoadesdale Ave Unit 2