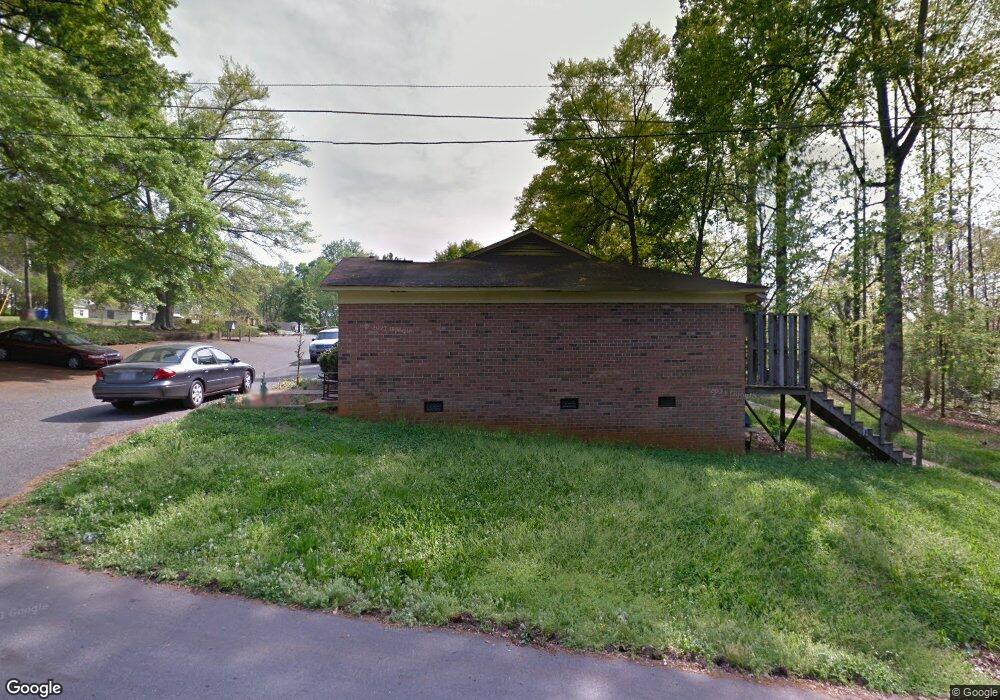
634 Hillcrest Dr Unit 8 Shelby, NC 28150
Estimated Value: $86,000 - $173,000
--
Bed
--
Bath
681
Sq Ft
$183/Sq Ft
Est. Value
About This Home
This home is located at 634 Hillcrest Dr Unit 8, Shelby, NC 28150 and is currently estimated at $124,383, approximately $182 per square foot. 634 Hillcrest Dr Unit 8 is a home located in Cleveland County with nearby schools including Graham Elementary School, Shelby Middle School, and Shelby High School.
Ownership History
Date
Name
Owned For
Owner Type
Purchase Details
Closed on
Jul 28, 2015
Sold by
Porchlight Llc
Bought by
Morris Sarah C and Butler Courtland N
Current Estimated Value
Purchase Details
Closed on
May 31, 2013
Sold by
Legg Hudgins Christie Kay and Hudgins William Terry
Bought by
Porchlight Llc
Purchase Details
Closed on
May 18, 2011
Sold by
Mannafest Llc
Bought by
Legg Christie Kay
Purchase Details
Closed on
Feb 16, 2011
Sold by
Legg Christie Kay
Bought by
Mannafest Llc
Purchase Details
Closed on
Jan 27, 2011
Sold by
Mannafest Llc
Bought by
Legg Christie Kay
Purchase Details
Closed on
Nov 23, 2010
Sold by
Shalom Properties Llc
Bought by
Mannafest Llc
Purchase Details
Closed on
Jan 16, 2009
Sold by
Wth Properties Llc
Bought by
Amm Properties Of North Carolina Llc
Purchase Details
Closed on
Aug 24, 2005
Sold by
The Cit Group Consumer Inc
Bought by
Wth Properties Llc
Create a Home Valuation Report for This Property
The Home Valuation Report is an in-depth analysis detailing your home's value as well as a comparison with similar homes in the area
Home Values in the Area
Average Home Value in this Area
Purchase History
| Date | Buyer | Sale Price | Title Company |
|---|---|---|---|
| Morris Sarah C | $30,000 | None Available | |
| Porchlight Llc | -- | None Available | |
| Legg Christie Kay | -- | None Available | |
| Mannafest Llc | -- | None Available | |
| Legg Christie Kay | $43,000 | None Available | |
| Mannafest Llc | -- | None Available | |
| Amm Properties Of North Carolina Llc | -- | None Available | |
| Wth Properties Llc | $16,000 | None Available |
Source: Public Records
Tax History Compared to Growth
Tax History
| Year | Tax Paid | Tax Assessment Tax Assessment Total Assessment is a certain percentage of the fair market value that is determined by local assessors to be the total taxable value of land and additions on the property. | Land | Improvement |
|---|---|---|---|---|
| 2025 | $419 | $42,128 | $0 | $42,128 |
| 2024 | $533 | $42,128 | $0 | $42,128 |
| 2023 | $530 | $42,128 | $0 | $42,128 |
| 2022 | $530 | $42,128 | $0 | $42,128 |
| 2021 | $533 | $42,128 | $0 | $42,128 |
| 2020 | $480 | $36,818 | $0 | $36,818 |
| 2019 | $480 | $36,818 | $0 | $36,818 |
| 2018 | $478 | $36,818 | $0 | $36,818 |
| 2017 | $467 | $36,818 | $0 | $36,818 |
| 2016 | $467 | $36,818 | $0 | $36,818 |
| 2015 | $520 | $43,390 | $0 | $43,390 |
| 2014 | $520 | $43,390 | $0 | $43,390 |
Source: Public Records
Map
Nearby Homes
- 1010 N Morgan St
- 311 Best St
- 108 Lee St
- 514 W Sumter St
- 608 Hanover Dr
- 628 Westover Terrace
- 703 Westover Terrace
- 211 Worthington St
- 601 W Marion St
- 415 W Warren St
- 406 Jacob St
- 615 W Warren St
- 417 W Graham St
- 340 Hudson St
- 421 Carolina Ave
- 724 W Warren St
- 201 S Washington St Unit 406
- 406 Hudson St
- 609 Buffalo St
- 615 Buffalo St
- 634 Hillcrest Dr Unit 2
- 634 Hillcrest Dr Unit 7
- 634 Hillcrest Dr Unit 6
- 634 Hillcrest Dr Unit 5
- 634 Hillcrest Dr Unit 4
- 634 Hillcrest Dr Unit 3
- 634 Hillcrest Dr Unit 1
- 634 Hillcrest Dr
- 408 Ford St
- 627 Hillcrest Dr
- 631 Hillcrest Dr
- 405 Ford St
- 625 Hillcrest Dr
- 306 Ford St
- 317 Ford St
- 204 Esther Ct
- 208 Esther Ct
- 401 Ford St
- 630 Hillcrest Dr
- 623 Hillcrest Dr