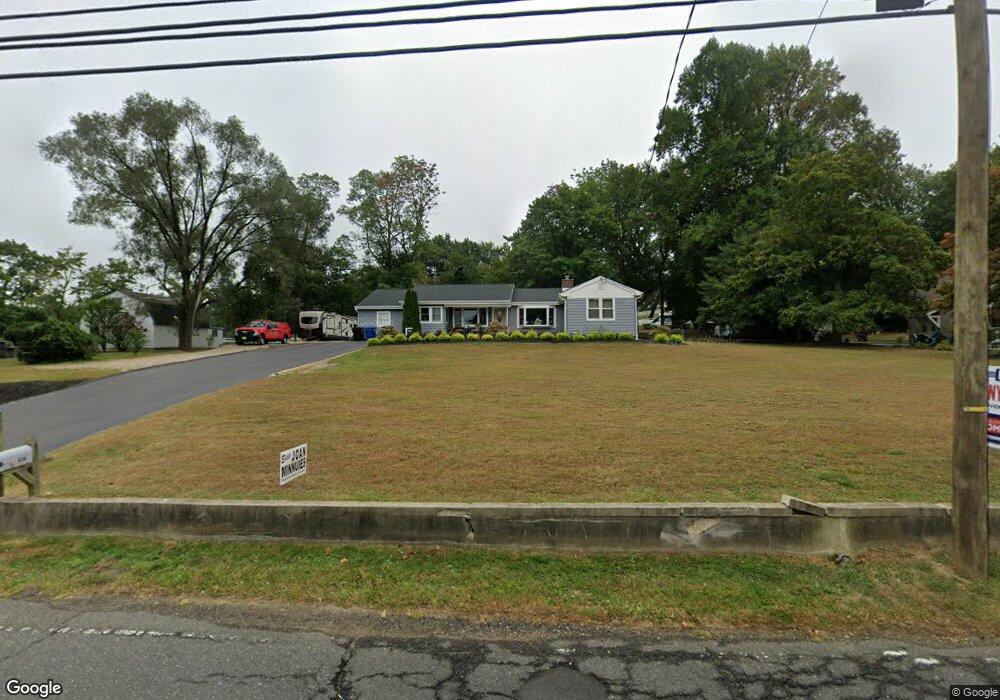
634 Locust Point Rd Rumson, NJ 07760
Locust NeighborhoodEstimated Value: $833,000 - $1,208,000
3
Beds
2
Baths
2,105
Sq Ft
$475/Sq Ft
Est. Value
About This Home
This home is located at 634 Locust Point Rd, Rumson, NJ 07760 and is currently estimated at $999,978, approximately $475 per square foot. 634 Locust Point Rd is a home located in Monmouth County with nearby schools including Navesink Elementary School, Bayshore Middle School, and Middletown - South High School.
Ownership History
Date
Name
Owned For
Owner Type
Purchase Details
Closed on
Jan 9, 2018
Sold by
Ryan Bethany L
Bought by
Ryan Bethany L and Morrissey Kevin W
Current Estimated Value
Purchase Details
Closed on
Apr 17, 2012
Sold by
Naclerio James
Bought by
Naclerio Bethany L
Purchase Details
Closed on
Sep 22, 2007
Sold by
Groves Catherine and Naclerio Bethany L
Bought by
Naclerio Bethany L and Naclerio James
Home Financials for this Owner
Home Financials are based on the most recent Mortgage that was taken out on this home.
Original Mortgage
$245,000
Outstanding Balance
$154,640
Interest Rate
6.51%
Mortgage Type
New Conventional
Estimated Equity
$845,339
Purchase Details
Closed on
Jan 26, 2007
Sold by
Groves Arthur H
Bought by
Groves Catherine and Naclerio Bethany L
Create a Home Valuation Report for This Property
The Home Valuation Report is an in-depth analysis detailing your home's value as well as a comparison with similar homes in the area
Home Values in the Area
Average Home Value in this Area
Purchase History
| Date | Buyer | Sale Price | Title Company |
|---|---|---|---|
| Ryan Bethany L | -- | -- | |
| Naclerio Bethany L | -- | None Available | |
| Naclerio Bethany L | -- | Monmouth Title Agency Inc | |
| Groves Catherine | -- | -- |
Source: Public Records
Mortgage History
| Date | Status | Borrower | Loan Amount |
|---|---|---|---|
| Open | Naclerio Bethany L | $245,000 |
Source: Public Records
Tax History Compared to Growth
Tax History
| Year | Tax Paid | Tax Assessment Tax Assessment Total Assessment is a certain percentage of the fair market value that is determined by local assessors to be the total taxable value of land and additions on the property. | Land | Improvement |
|---|---|---|---|---|
| 2025 | $12,456 | $966,400 | $697,600 | $268,800 |
| 2024 | $10,531 | $757,200 | $493,400 | $263,800 |
| 2023 | $10,531 | $605,900 | $410,500 | $195,400 |
| 2022 | $8,511 | $446,300 | $260,200 | $186,100 |
| 2021 | $8,511 | $409,200 | $243,700 | $165,500 |
| 2020 | $8,849 | $413,900 | $252,100 | $161,800 |
| 2019 | $8,720 | $412,900 | $252,100 | $160,800 |
| 2018 | $8,757 | $404,100 | $250,700 | $153,400 |
| 2017 | $9,200 | $420,300 | $250,700 | $169,600 |
| 2016 | $8,865 | $416,000 | $250,700 | $165,300 |
| 2015 | $9,172 | $415,600 | $250,700 | $164,900 |
| 2014 | $9,084 | $401,400 | $250,700 | $150,700 |
Source: Public Records
Map
Nearby Homes
- 139 Monmouth Ave
- 185 Monmouth Ave
- 96 East Ave Unit 92
- HAMPSHIRE Plan at Central Ave
- 498 Central Ave
- 502 Central Ave
- 500 Central Ave
- 7100 Prospect Ave
- 6998 Prospect Ave
- 38 East Ave
- 34 Serpentine Dr
- 18 Middletown Ave
- 59 Asbury Ave
- 90 E Lincoln Ave
- 4 Isabella Ct
- 119 Chestnut Ave
- 809 Navesink River Rd
- 61 E Washington Ave
- 18 Clay Ct
- 934 Navesink River Rd
- 638 Locust Point Rd
- 628 Locust Point Rd
- 633 Locust Point Rd
- 642 Locust Point Rd
- 629 Locust Point Rd
- 637 Locust Point Rd
- 641 Locust Point Rd
- 650 Locust Point Rd
- 645 Locust Point Rd
- 625 Locust Point Rd
- 617 Locust Point Rd
- 621 Locust Point Rd
- 649 Locust Point Rd
- 654 Locust Point Rd
- 613 Locust Point Rd
- 653 Locust Point Rd
- 609 Locust Point Rd
- 657 Locust Point Rd
- 658 Locust Point Rd
- 35 Latham Ave