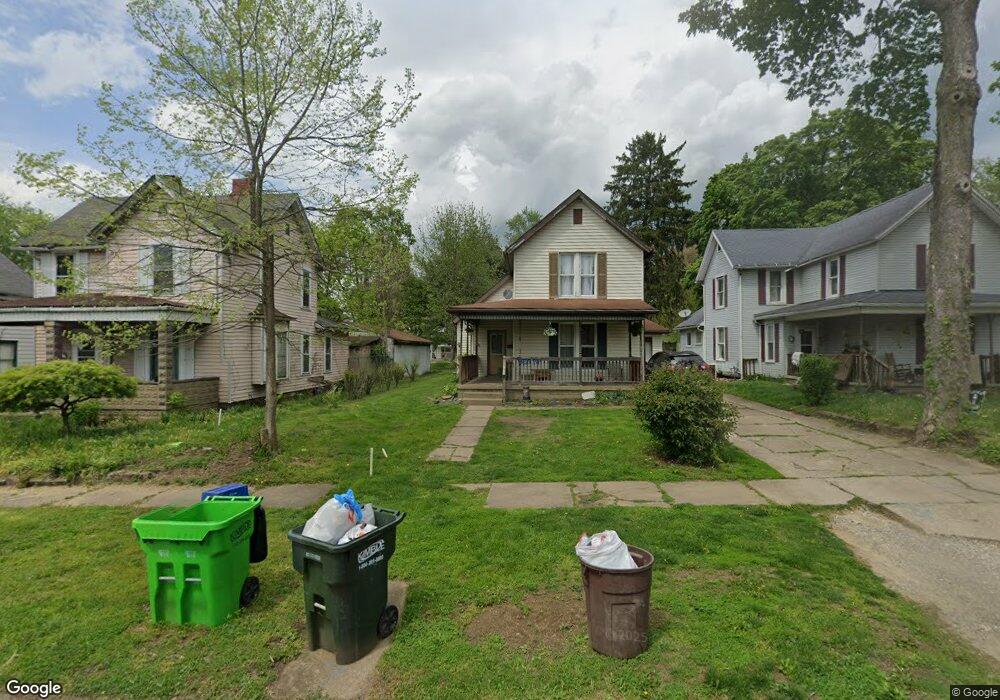
634 Locust St Coshocton, OH 43812
Estimated Value: $116,000 - $131,000
3
Beds
2
Baths
1,752
Sq Ft
$72/Sq Ft
Est. Value
About This Home
This home is located at 634 Locust St, Coshocton, OH 43812 and is currently estimated at $125,726, approximately $71 per square foot. 634 Locust St is a home located in Coshocton County with nearby schools including Coshocton High School, Coshocton Opportunity School, and Sacred Heart School.
Ownership History
Date
Name
Owned For
Owner Type
Purchase Details
Closed on
Oct 19, 2022
Sold by
Unknown
Bought by
Avodah Property Services Llc
Current Estimated Value
Purchase Details
Closed on
Apr 13, 2011
Sold by
Federal Home Loan Mortgaeg Corp
Bought by
Maple William I
Purchase Details
Closed on
Jan 26, 2011
Sold by
Mcclain Brian C
Bought by
Federal Home Loan Mortgage Corporation
Purchase Details
Closed on
Feb 28, 1994
Bought by
Mcclain Brian C
Purchase Details
Closed on
Aug 30, 1993
Sold by
Chaney Kenneth W
Bought by
Ford Consumer Finance Company
Create a Home Valuation Report for This Property
The Home Valuation Report is an in-depth analysis detailing your home's value as well as a comparison with similar homes in the area
Home Values in the Area
Average Home Value in this Area
Purchase History
| Date | Buyer | Sale Price | Title Company |
|---|---|---|---|
| Avodah Property Services Llc | $50,000 | Fidelity Title | |
| Maple William I | $17,500 | None Available | |
| Federal Home Loan Mortgage Corporation | $16,667 | None Available | |
| Mcclain Brian C | $29,000 | -- | |
| Ford Consumer Finance Company | -- | -- |
Source: Public Records
Tax History Compared to Growth
Tax History
| Year | Tax Paid | Tax Assessment Tax Assessment Total Assessment is a certain percentage of the fair market value that is determined by local assessors to be the total taxable value of land and additions on the property. | Land | Improvement |
|---|---|---|---|---|
| 2024 | $1,124 | $26,620 | $4,450 | $22,170 |
| 2023 | $1,124 | $20,948 | $3,423 | $17,525 |
| 2022 | $1,023 | $20,948 | $3,423 | $17,525 |
| 2021 | $1,025 | $20,948 | $3,423 | $17,525 |
| 2020 | $945 | $18,687 | $3,332 | $15,355 |
| 2019 | $956 | $18,687 | $3,332 | $15,355 |
| 2018 | $949 | $18,687 | $3,332 | $15,355 |
| 2017 | $972 | $18,467 | $3,112 | $15,355 |
| 2016 | $934 | $18,467 | $3,112 | $15,355 |
| 2015 | $469 | $18,467 | $3,112 | $15,355 |
| 2014 | $1,362 | $18,641 | $4,151 | $14,490 |
Source: Public Records
Map
Nearby Homes