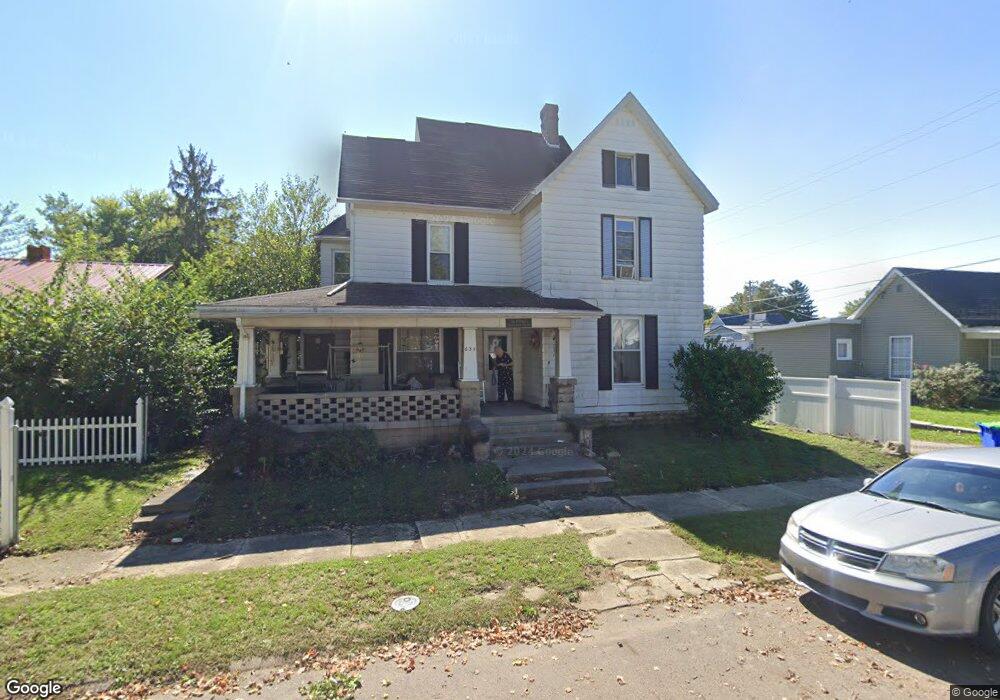
634 Lyndon Ave Greenfield, OH 45123
Estimated Value: $83,000 - $179,000
2
Beds
2
Baths
2,279
Sq Ft
$58/Sq Ft
Est. Value
About This Home
This home is located at 634 Lyndon Ave, Greenfield, OH 45123 and is currently estimated at $133,295, approximately $58 per square foot. 634 Lyndon Ave is a home located in Highland County with nearby schools including McClain High School.
Ownership History
Date
Name
Owned For
Owner Type
Purchase Details
Closed on
Jun 6, 2014
Sold by
Homeland Credit Union Inc
Bought by
Pollock Larry F and Pollock Donna J
Current Estimated Value
Purchase Details
Closed on
Nov 22, 2011
Sold by
Douglas David A
Bought by
Homeland Credit Union Inc
Purchase Details
Closed on
Jun 24, 2008
Sold by
Douglas Christina L and Lanning Christina L
Bought by
Douglas David A
Purchase Details
Closed on
Nov 1, 2006
Sold by
Douglas David A and Douglas Christina L
Bought by
Baker Duane and Baker Nancy
Home Financials for this Owner
Home Financials are based on the most recent Mortgage that was taken out on this home.
Original Mortgage
$86,500
Interest Rate
7.42%
Mortgage Type
Land Contract Argmt. Of Sale
Purchase Details
Closed on
Jan 18, 1995
Sold by
Parker Drew B
Bought by
Douglas David A and Lenning Christina L
Purchase Details
Closed on
Jan 1, 1990
Bought by
Parker Drew B and Parker Sandra J
Create a Home Valuation Report for This Property
The Home Valuation Report is an in-depth analysis detailing your home's value as well as a comparison with similar homes in the area
Home Values in the Area
Average Home Value in this Area
Purchase History
| Date | Buyer | Sale Price | Title Company |
|---|---|---|---|
| Pollock Larry F | $23,500 | Title First Agency Inc | |
| Homeland Credit Union Inc | $28,000 | None Available | |
| Douglas David A | -- | Attorney | |
| Baker Duane | $87,500 | Attorney | |
| Douglas David A | $31,500 | -- | |
| Parker Drew B | -- | -- |
Source: Public Records
Mortgage History
| Date | Status | Borrower | Loan Amount |
|---|---|---|---|
| Previous Owner | Baker Duane | $86,500 |
Source: Public Records
Tax History
| Year | Tax Paid | Tax Assessment Tax Assessment Total Assessment is a certain percentage of the fair market value that is determined by local assessors to be the total taxable value of land and additions on the property. | Land | Improvement |
|---|---|---|---|---|
| 2024 | $947 | $40,820 | $3,890 | $36,930 |
| 2023 | $964 | $23,310 | $3,220 | $20,090 |
| 2022 | $421 | $23,310 | $3,220 | $20,090 |
| 2021 | $475 | $23,310 | $3,220 | $20,090 |
| 2020 | $386 | $20,270 | $2,800 | $17,470 |
| 2019 | $392 | $20,270 | $2,800 | $17,470 |
| 2018 | $394 | $20,270 | $2,800 | $17,470 |
| 2017 | $414 | $20,760 | $2,590 | $18,170 |
| 2016 | $415 | $20,760 | $2,590 | $18,170 |
| 2015 | $1,561 | $20,760 | $2,590 | $18,170 |
| 2014 | $804 | $20,760 | $2,590 | $18,170 |
| 2013 | $806 | $20,760 | $2,590 | $18,170 |
Source: Public Records
Map
Nearby Homes
- 534 Waddell St
- 814 South St
- 906 South St
- 910 South St
- 358 Mirabeau St
- 228 Lafayette St
- 0 Lafayette St
- 739 Lafayette St
- 433 Jefferson St
- 127 Paint St
- 126 Smith St
- 235 S 2nd St
- 111 South St
- 321 Mcclain Ave
- 13455 State Route 28 W
- 518 N Washington St
- 965 Grandview Ave
- 13528 Hillcrest Dr
- 14505 State Route 41 S
- 12835 Bennett Rd
Your Personal Tour Guide
Ask me questions while you tour the home.