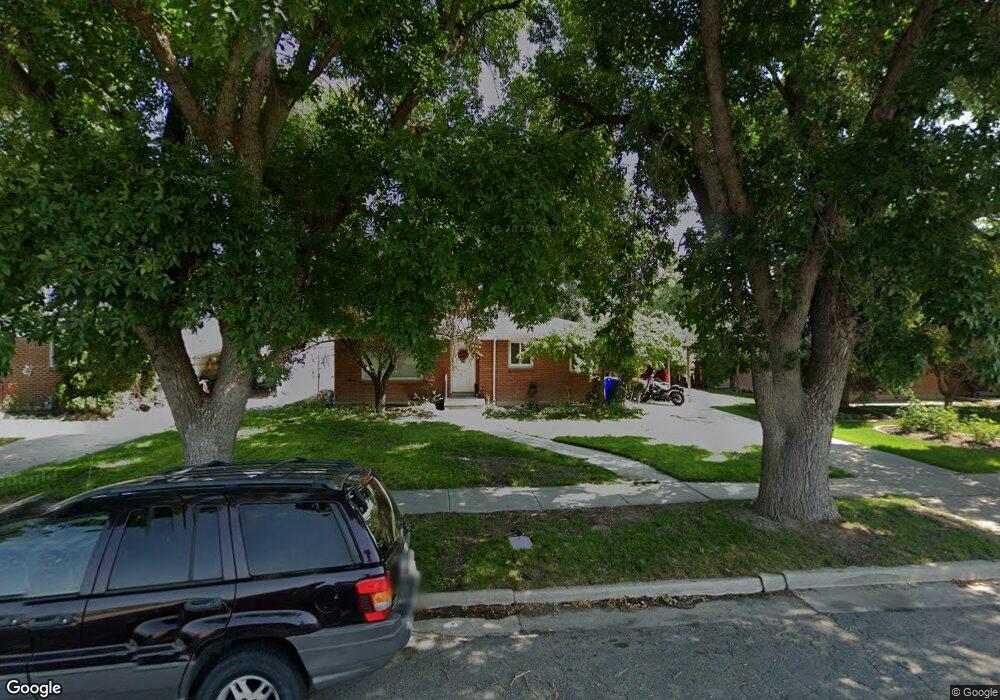
634 N 100 E Tremonton, UT 84337
Estimated Value: $323,000 - $346,142
Studio
--
Bath
890
Sq Ft
$378/Sq Ft
Est. Value
About This Home
This home is located at 634 N 100 E, Tremonton, UT 84337 and is currently estimated at $336,286, approximately $377 per square foot. 634 N 100 E is a home with nearby schools including North Park School, Bear River Middle School, and Alice C. Harris Intermediate School.
Ownership History
Date
Name
Owned For
Owner Type
Purchase Details
Closed on
May 1, 2020
Sold by
Crook Mary J
Bought by
Gage Jeremy D
Current Estimated Value
Home Financials for this Owner
Home Financials are based on the most recent Mortgage that was taken out on this home.
Original Mortgage
$164,800
Outstanding Balance
$146,848
Interest Rate
3.6%
Mortgage Type
New Conventional
Estimated Equity
$189,438
Purchase Details
Closed on
Aug 13, 2012
Sold by
Gage Jack R
Bought by
Crook Mary J
Purchase Details
Closed on
Feb 26, 2007
Sold by
Crook Mary J
Bought by
Gage Jack R and Gage Richard J
Create a Home Valuation Report for This Property
The Home Valuation Report is an in-depth analysis detailing your home's value as well as a comparison with similar homes in the area
Home Values in the Area
Average Home Value in this Area
Purchase History
| Date | Buyer | Sale Price | Title Company |
|---|---|---|---|
| Gage Jeremy D | -- | American Secure Ttl Tremonto | |
| Crook Mary J | -- | Accommodation | |
| Crook Mary J | -- | Accommodation | |
| Gage Jack R | -- | None Available |
Source: Public Records
Mortgage History
| Date | Status | Borrower | Loan Amount |
|---|---|---|---|
| Open | Gage Jeremy D | $164,800 |
Source: Public Records
Tax History
| Year | Tax Paid | Tax Assessment Tax Assessment Total Assessment is a certain percentage of the fair market value that is determined by local assessors to be the total taxable value of land and additions on the property. | Land | Improvement |
|---|---|---|---|---|
| 2025 | $2,047 | $318,463 | $105,000 | $213,463 |
| 2024 | $1,828 | $316,578 | $105,000 | $211,578 |
| 2023 | $1,834 | $311,800 | $100,000 | $211,800 |
| 2022 | $1,649 | $159,889 | $16,500 | $143,389 |
| 2021 | $1,305 | $167,855 | $30,000 | $137,855 |
| 2020 | $1,090 | $167,855 | $30,000 | $137,855 |
| 2019 | $1,017 | $83,598 | $16,500 | $67,098 |
| 2018 | $833 | $62,520 | $13,750 | $48,770 |
| 2017 | $861 | $113,673 | $13,750 | $88,673 |
| 2016 | $849 | $60,198 | $13,750 | $46,448 |
| 2015 | $777 | $55,975 | $13,750 | $42,225 |
| 2014 | $777 | $0 | $0 | $0 |
| 2013 | -- | $53,965 | $13,338 | $40,627 |
Source: Public Records
Map
Nearby Homes
- 524 N 100 E
- 785 N 200 E
- 278 N 870 E
- 278 N 870 E Unit 17
- 384 N 200 E
- 780 N 350 E
- 960 N 100 W
- 978 N Tremont St
- 116 N Tremont St
- 117 N 100 W
- 708 N 600 W Unit 107
- 708 N 600 W
- 776 N 600 W Unit 210
- 776 N 600 W
- 678 N 600 W Unit 103
- 672 N 600 W
- 725 N 600 W Unit 111
- 711 N 600 W Unit 113
- 719 N 600 W Unit 112
- 635 E 240 N Unit 9
Your Personal Tour Guide
Ask me questions while you tour the home.