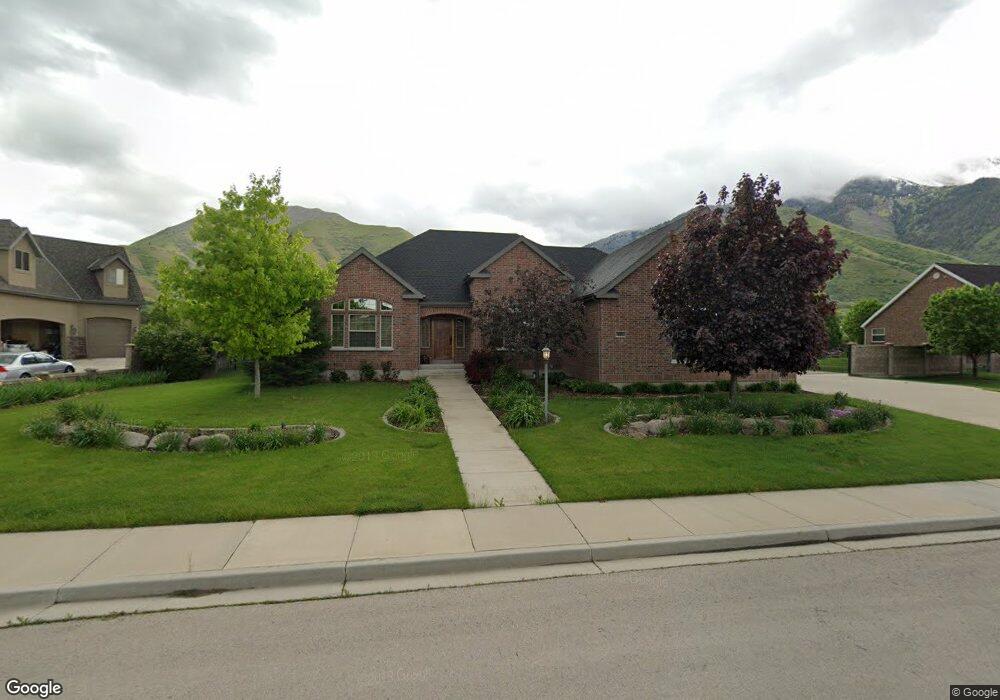
634 N 1200 E Unit 5 Mapleton, UT 84664
Estimated Value: $1,007,000 - $1,284,000
3
Beds
2
Baths
2,387
Sq Ft
$492/Sq Ft
Est. Value
About This Home
This home is located at 634 N 1200 E Unit 5, Mapleton, UT 84664 and is currently estimated at $1,174,928, approximately $492 per square foot. 634 N 1200 E Unit 5 is a home located in Utah County with nearby schools including Hobble Creek School, Mapleton Junior High School, and Maple Mountain High School.
Ownership History
Date
Name
Owned For
Owner Type
Purchase Details
Closed on
Oct 25, 2012
Sold by
United State Of America
Bought by
Wayment Thomas and Wayment Brandi
Current Estimated Value
Home Financials for this Owner
Home Financials are based on the most recent Mortgage that was taken out on this home.
Original Mortgage
$412,000
Outstanding Balance
$284,025
Interest Rate
3.34%
Mortgage Type
New Conventional
Estimated Equity
$890,903
Purchase Details
Closed on
Mar 5, 2007
Sold by
Nielsen Richard Page and Nielsen Vicki Stone
Bought by
Wayment Thomas and Wayment Brandi
Home Financials for this Owner
Home Financials are based on the most recent Mortgage that was taken out on this home.
Original Mortgage
$415,000
Interest Rate
6.29%
Mortgage Type
Construction
Create a Home Valuation Report for This Property
The Home Valuation Report is an in-depth analysis detailing your home's value as well as a comparison with similar homes in the area
Home Values in the Area
Average Home Value in this Area
Purchase History
| Date | Buyer | Sale Price | Title Company |
|---|---|---|---|
| Wayment Thomas | -- | None Available | |
| Wayment Thomas | -- | Access Title Company |
Source: Public Records
Mortgage History
| Date | Status | Borrower | Loan Amount |
|---|---|---|---|
| Open | Wayment Thomas | $412,000 | |
| Previous Owner | Wayment Thomas | $415,000 |
Source: Public Records
Tax History
| Year | Tax Paid | Tax Assessment Tax Assessment Total Assessment is a certain percentage of the fair market value that is determined by local assessors to be the total taxable value of land and additions on the property. | Land | Improvement |
|---|---|---|---|---|
| 2025 | $5,706 | $592,020 | -- | -- |
| 2024 | $5,706 | $559,020 | $0 | $0 |
| 2023 | $5,921 | $583,660 | $0 | $0 |
| 2022 | $5,969 | $581,790 | $0 | $0 |
| 2021 | $4,897 | $732,800 | $300,500 | $432,300 |
| 2020 | $4,811 | $696,500 | $280,800 | $415,700 |
| 2019 | $4,312 | $637,200 | $275,700 | $361,500 |
| 2018 | $4,281 | $602,100 | $240,600 | $361,500 |
| 2017 | $4,362 | $325,655 | $0 | $0 |
| 2016 | $4,022 | $298,430 | $0 | $0 |
| 2015 | $3,648 | $269,060 | $0 | $0 |
| 2014 | -- | $233,805 | $0 | $0 |
Source: Public Records
Map
Nearby Homes
- 775 N 800 E
- 1096 N 1000 E
- 310 N 800 E
- 630 N 1600 E
- 162 N 800 E
- 1515 E Maple St
- 1548 N 1350 St E Unit 11
- 1578 N 1350 St E Unit 12
- 1377 E Maple St
- 1447 N 1350 St E Unit 5
- 1577 N 1350 St E Unit 1
- 1477 N 1350 St E Unit 4
- 1547 N 1350 St E Unit 2
- 1511 N 1350 St E Unit 3
- 594 E 1000 N
- 745 E Maple St
- 702 N 2000 E Unit 305
- 1564 N 1700 East St
- 764 N 2000 E
- 141 N 600 E
- 634 N 1200 E
- 676 N 1200 E
- 676 N 1200 E Unit 6
- 588 N 1200 E Unit 4
- 655 N 1200 E
- 607 N 1200 E Unit 13
- 607 N 1200 E
- 697 N 1200 E Unit 11
- 720 N 1200 E Unit 7
- 559 N 1200 E
- 534 N 1200 E
- 534 N 1200 E Unit 3
- 739 N 1200 E
- 760 N 1200 E
- 511 N 1200 E Unit 15
- 767 N 1200 E
- 767 N 1200 E Unit 9
- 555 N 1400 E
- 480 N 1200 E Unit 2
- 810 N 1200 E
Your Personal Tour Guide
Ask me questions while you tour the home.