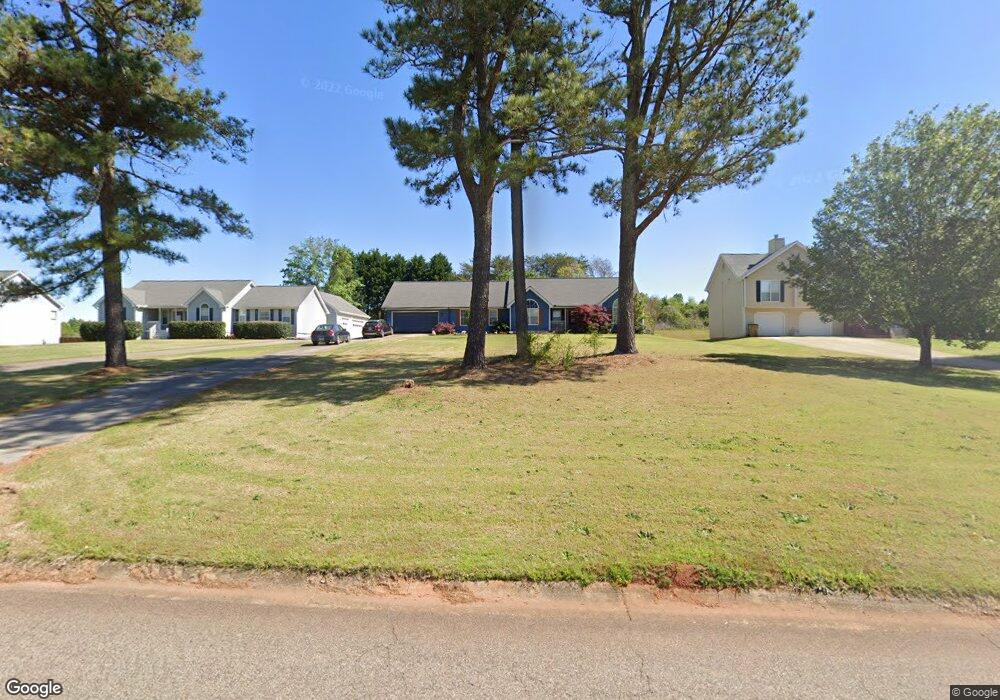
634 Rivermill Rd Unit 1 Bethlehem, GA 30620
Estimated Value: $327,000 - $363,000
3
Beds
2
Baths
2,111
Sq Ft
$165/Sq Ft
Est. Value
About This Home
This home is located at 634 Rivermill Rd Unit 1, Bethlehem, GA 30620 and is currently estimated at $348,419, approximately $165 per square foot. 634 Rivermill Rd Unit 1 is a home located in Barrow County with nearby schools including Yargo Elementary School, Haymon-Morris Middle School, and Apalachee High School.
Ownership History
Date
Name
Owned For
Owner Type
Purchase Details
Closed on
Dec 17, 2012
Sold by
Hannah Jennifer
Bought by
Hannah Robert T
Current Estimated Value
Home Financials for this Owner
Home Financials are based on the most recent Mortgage that was taken out on this home.
Original Mortgage
$91,000
Outstanding Balance
$62,401
Interest Rate
3.38%
Mortgage Type
New Conventional
Estimated Equity
$286,018
Purchase Details
Closed on
Nov 17, 1998
Sold by
Milson Andrew and Milson Lori
Bought by
Hannah Robert T and Hannah Jennifer
Home Financials for this Owner
Home Financials are based on the most recent Mortgage that was taken out on this home.
Original Mortgage
$97,850
Interest Rate
6.9%
Mortgage Type
New Conventional
Purchase Details
Closed on
Jun 12, 1996
Sold by
Brittingham Diane
Bought by
Milson Andrew Lori
Purchase Details
Closed on
Nov 29, 1993
Bought by
Developme Dun La Hur
Create a Home Valuation Report for This Property
The Home Valuation Report is an in-depth analysis detailing your home's value as well as a comparison with similar homes in the area
Home Values in the Area
Average Home Value in this Area
Purchase History
We collect this data history from publicly available records. To have your information removed, we recommend requesting removal directly through your county’s website.
| Date | Buyer | Sale Price | Title Company |
|---|---|---|---|
| Hannah Robert T | -- | -- | |
| Hannah Robert T | $103,000 | -- | |
| Milson Andrew Lori | $95,000 | -- | |
| Developme Dun La Hur | -- | -- |
Source: Public Records
Mortgage History
We collect this data history from publicly available records. To have your information removed, we recommend requesting removal directly through your county’s website.
| Date | Status | Borrower | Loan Amount |
|---|---|---|---|
| Open | Hannah Robert T | $91,000 | |
| Previous Owner | Hannah Robert T | $97,850 |
Source: Public Records
Tax History
| Year | Tax Paid | Tax Assessment Tax Assessment Total Assessment is a certain percentage of the fair market value that is determined by local assessors to be the total taxable value of land and additions on the property. | Land | Improvement |
|---|---|---|---|---|
| 2025 | $2,554 | $125,340 | $25,600 | $99,740 |
| 2024 | $2,460 | $114,877 | $21,600 | $93,277 |
| 2023 | $2,043 | $115,277 | $21,600 | $93,677 |
| 2022 | $2,186 | $87,500 | $21,600 | $65,900 |
| 2021 | $1,946 | $73,343 | $16,800 | $56,543 |
| 2020 | $1,759 | $65,664 | $13,800 | $51,864 |
| 2019 | $1,784 | $65,664 | $13,800 | $51,864 |
| 2018 | $1,752 | $65,664 | $13,800 | $51,864 |
| 2017 | $1,445 | $49,613 | $13,800 | $35,813 |
| 2016 | $1,304 | $48,258 | $13,800 | $34,458 |
| 2015 | $1,318 | $48,673 | $13,800 | $34,873 |
| 2014 | $1,193 | $42,466 | $6,762 | $35,704 |
| 2013 | -- | $40,253 | $6,762 | $33,491 |
Source: Public Records
Map
Nearby Homes
- 1408 Water Wheel Dr
- 293 Meadows Dr
- 253 Meadows Dr
- 330 Meadows Dr
- 308 Meadows Dr
- 650 Sleeping Meadow Ln
- 637 Sleeping Meadow Ln
- 649 Tanners Bridge Rd
- 189 Marie Ct
- 236 Camp Ct
- 7512 Fieldstone Way Unit 7
- 8255 Shadow Creek Dr
- 1505 Mill Creek Rd
- 8215 Highway 81
- 1029 Preserve Ln
- 924 Beaver Hill Dr Unit 21
- 924 Beaver Hill Dr
- 8165 Highway 81
- 1007 Preserve Ln
- 925 Nature Trail Unit 2
- 636 Rivermill Rd
- 632 Rivermill Rd
- 638 Rivermill Rd
- 1440 Millstone Ct
- 640 Rivermill Rd
- 628 Rivermill Rd
- 628 River Mill Rd
- 1442 Millstone Ct
- 1441 Millstone Ct
- 1461 Riveredge Ct
- 642 Rivermill Rd
- 626 Rivermill Rd
- 1443 Millstone Ct
- 1444 Millstone Ct
- 1463 Riveredge Ct
- 644 Rivermill Rd
- 624 Rivermill Rd
- 1445 Millstone Ct
- 1465 Riveredge Ct
- 1446 Millstone Ct
Your Personal Tour Guide
Ask me questions while you tour the home.