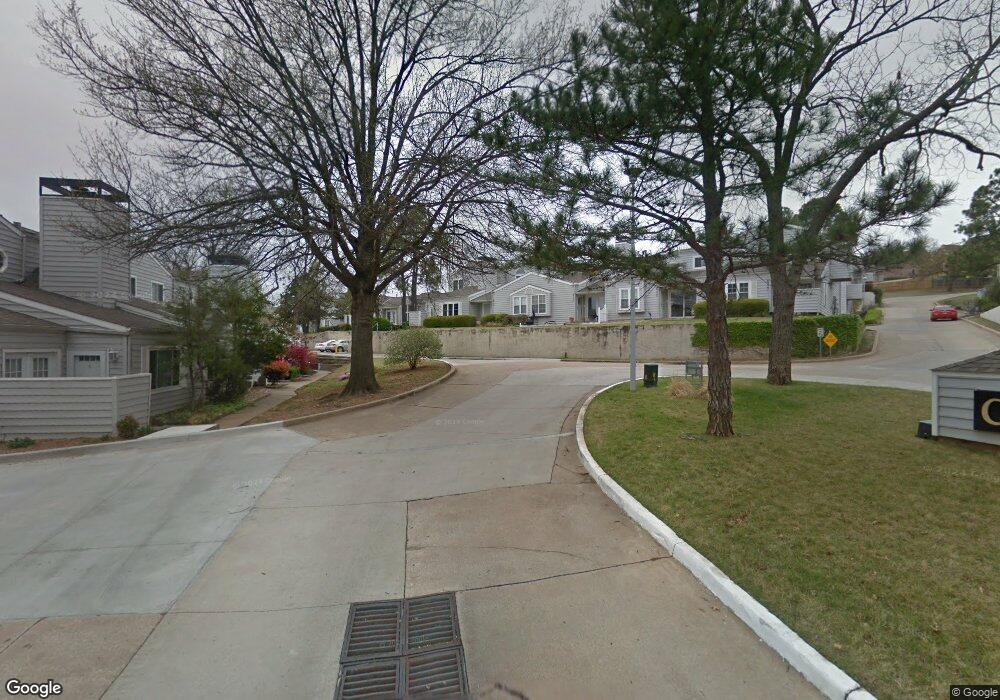
6340 E 89th Place Unit 904 Tulsa, OK 74137
Brookwood NeighborhoodEstimated Value: $191,000 - $203,000
--
Bed
3
Baths
1,279
Sq Ft
$153/Sq Ft
Est. Value
About This Home
This home is located at 6340 E 89th Place Unit 904, Tulsa, OK 74137 and is currently estimated at $196,310, approximately $153 per square foot. 6340 E 89th Place Unit 904 is a home located in Tulsa County with nearby schools including Darnaby Elementary School, Union 8th Grade Center, and Union 6th-7th Grade Center.
Ownership History
Date
Name
Owned For
Owner Type
Purchase Details
Closed on
Dec 5, 2022
Sold by
Mckeon Allison Nicole
Bought by
Cordero Anita Leola
Current Estimated Value
Purchase Details
Closed on
Jul 7, 2020
Sold by
Bode Kristin L and Bode Aaron
Bought by
Mckeon Allison Nicole
Home Financials for this Owner
Home Financials are based on the most recent Mortgage that was taken out on this home.
Original Mortgage
$90,000
Interest Rate
3.1%
Mortgage Type
New Conventional
Purchase Details
Closed on
Jan 25, 2005
Sold by
Walsh Karen M
Bought by
Turner Kristin L
Home Financials for this Owner
Home Financials are based on the most recent Mortgage that was taken out on this home.
Original Mortgage
$85,400
Interest Rate
5.8%
Mortgage Type
Purchase Money Mortgage
Purchase Details
Closed on
Oct 1, 1993
Purchase Details
Closed on
Jan 1, 1990
Create a Home Valuation Report for This Property
The Home Valuation Report is an in-depth analysis detailing your home's value as well as a comparison with similar homes in the area
Home Values in the Area
Average Home Value in this Area
Purchase History
| Date | Buyer | Sale Price | Title Company |
|---|---|---|---|
| Cordero Anita Leola | $163,500 | Executive Title | |
| Mckeon Allison Nicole | $113,000 | Firstitle & Abstract Svcs Ll | |
| Turner Kristin L | $85,500 | -- | |
| -- | $61,000 | -- | |
| -- | $46,500 | -- |
Source: Public Records
Mortgage History
| Date | Status | Borrower | Loan Amount |
|---|---|---|---|
| Previous Owner | Mckeon Allison Nicole | $90,000 | |
| Previous Owner | Turner Kristin L | $85,400 |
Source: Public Records
Tax History Compared to Growth
Tax History
| Year | Tax Paid | Tax Assessment Tax Assessment Total Assessment is a certain percentage of the fair market value that is determined by local assessors to be the total taxable value of land and additions on the property. | Land | Improvement |
|---|---|---|---|---|
| 2024 | $2,300 | $17,985 | $1,716 | $16,269 |
| 2023 | $2,300 | $17,985 | $1,716 | $16,269 |
| 2022 | $1,523 | $11,430 | $1,578 | $9,852 |
| 2021 | $1,542 | $11,430 | $1,578 | $9,852 |
| 2020 | $1,404 | $10,560 | $1,716 | $8,844 |
| 2019 | $1,454 | $10,560 | $1,716 | $8,844 |
| 2018 | $1,450 | $10,560 | $1,716 | $8,844 |
| 2017 | $1,459 | $10,560 | $1,716 | $8,844 |
| 2016 | $1,427 | $10,560 | $1,716 | $8,844 |
| 2015 | $1,442 | $10,560 | $1,716 | $8,844 |
| 2014 | $1,375 | $10,230 | $1,716 | $8,514 |
Source: Public Records
Map
Nearby Homes
- 6337 E 89th Place Unit 105
- 6330 E 89th Place Unit 1004
- 9003 S Maplewood Ave
- 6517 E 90th St
- 9034 S Maplewood Ave
- 6616 E 89th Place
- 6121 E 91st Place
- 8918 S Lakewood Ave
- 6629 E 88th St
- 6706 E 87th Place
- 0 E 85th Ct Unit 2527614
- 6215 E 86th Place
- 9141 S Lakewood Ave
- 8747 S 68th East Ave
- 8528 S Maplewood Ave
- 8529 S Maplewood Ave
- 8912 S 70th East Ave
- 6522 E 86th St
- 7020 E 89th St
- 7017 E 89th St
- 8916 S Oxford Ave Unit 203
- 6338 E 89th Place Unit 905
- 6324 E 89th Place Unit 1104
- 6342 E 89th Place Unit 903
- 8907 S Oxford Ave Unit 603
- 8904 S Oxford Ave Unit 304
- 8906 S Oxford Ave Unit 303
- 6428 E 89th St Unit 503
- 6348 E 89th Place Unit 801
- 8909 S Oxford Ave Unit 602
- 6432 E 89th St Unit 501
- 6321 E 89th Place Unit 1301
- 6331 E 89th Place Unit 102
- 6320 E 89th Place Unit 1102
- 6328 E 89th Place
- 6314 E 89th Place Unit 1203
- 6313 E 89th Place Unit 1305
- 6310 E 89th Place Unit 1201
- 6330 E 89th Place
- 6332 E 89th Place