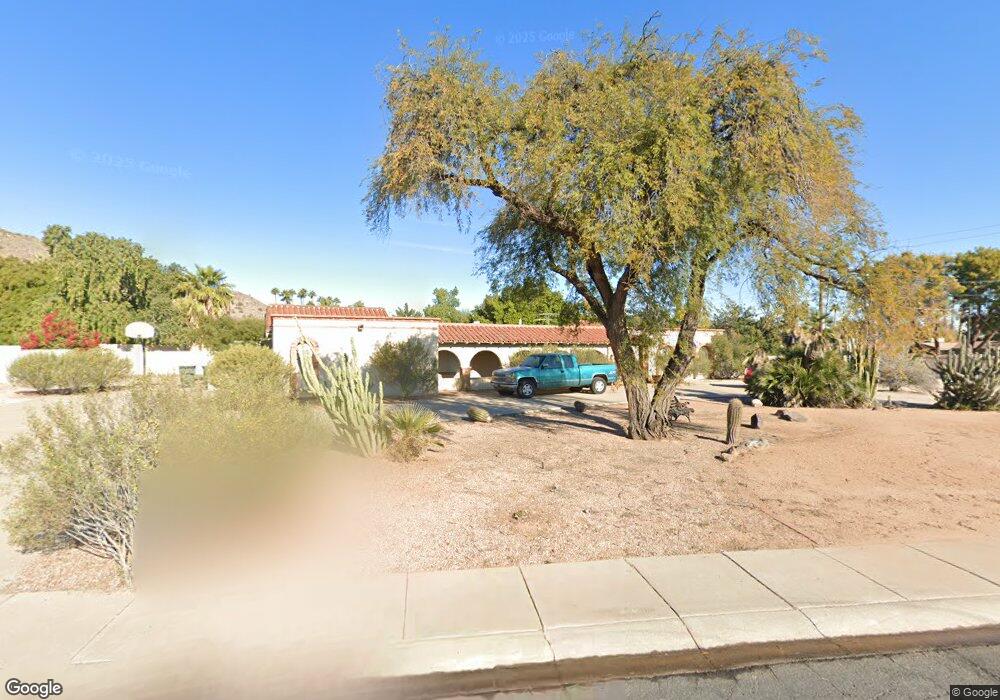
6342 E Alta Hacienda Dr Scottsdale, AZ 85251
Camelback East Village NeighborhoodEstimated Value: $2,883,629 - $3,408,000
--
Bed
4
Baths
3,702
Sq Ft
$826/Sq Ft
Est. Value
About This Home
This home is located at 6342 E Alta Hacienda Dr, Scottsdale, AZ 85251 and is currently estimated at $3,059,210, approximately $826 per square foot. 6342 E Alta Hacienda Dr is a home located in Maricopa County with nearby schools including Hopi Elementary School, Ingleside Middle School, and Arcadia High School.
Ownership History
Date
Name
Owned For
Owner Type
Purchase Details
Closed on
Apr 16, 2002
Sold by
Gartner William J and Gartner Jennifer F
Bought by
Palmer Mark
Current Estimated Value
Home Financials for this Owner
Home Financials are based on the most recent Mortgage that was taken out on this home.
Original Mortgage
$548,400
Outstanding Balance
$233,331
Interest Rate
7.18%
Mortgage Type
New Conventional
Estimated Equity
$2,825,879
Purchase Details
Closed on
Mar 22, 1999
Sold by
Gartner Jennifer F
Bought by
Gartner William J and Gartner Jennifer F
Home Financials for this Owner
Home Financials are based on the most recent Mortgage that was taken out on this home.
Original Mortgage
$400,000
Interest Rate
6.73%
Purchase Details
Closed on
Feb 14, 1997
Sold by
Gartner William J
Bought by
Gartner Jennifer F
Create a Home Valuation Report for This Property
The Home Valuation Report is an in-depth analysis detailing your home's value as well as a comparison with similar homes in the area
Home Values in the Area
Average Home Value in this Area
Purchase History
| Date | Buyer | Sale Price | Title Company |
|---|---|---|---|
| Palmer Mark | $685,500 | Security Title Agency | |
| Gartner William J | -- | Chicago Title Insurance Co | |
| Gartner Jennifer F | -- | Network Escrow & Title Agenc | |
| Gartner Jennifer F | $375,000 | Network Escrow & Title Agenc |
Source: Public Records
Mortgage History
| Date | Status | Borrower | Loan Amount |
|---|---|---|---|
| Open | Palmer Mark | $548,400 | |
| Previous Owner | Gartner William J | $400,000 |
Source: Public Records
Tax History Compared to Growth
Tax History
| Year | Tax Paid | Tax Assessment Tax Assessment Total Assessment is a certain percentage of the fair market value that is determined by local assessors to be the total taxable value of land and additions on the property. | Land | Improvement |
|---|---|---|---|---|
| 2025 | $7,631 | $100,022 | -- | -- |
| 2024 | $7,103 | $95,259 | -- | -- |
| 2023 | $7,103 | $120,860 | $24,170 | $96,690 |
| 2022 | $6,788 | $91,380 | $18,270 | $73,110 |
| 2021 | $7,058 | $90,310 | $18,060 | $72,250 |
| 2020 | $6,945 | $78,370 | $15,670 | $62,700 |
| 2019 | $7,865 | $98,630 | $19,720 | $78,910 |
| 2018 | $7,540 | $90,100 | $18,020 | $72,080 |
| 2017 | $7,221 | $89,170 | $17,830 | $71,340 |
| 2016 | $7,019 | $87,560 | $17,510 | $70,050 |
| 2015 | $6,385 | $81,360 | $16,270 | $65,090 |
Source: Public Records
Map
Nearby Homes
- 6230 E Hillcrest Blvd
- 6331 E Phoenician Blvd Unit 6
- 6311 E Phoenician Blvd Unit 19
- 6311 E Phoenician Blvd Unit 18
- 6500 E Camelback Rd Unit 1010
- 1 BR Loft+ Den Plan at Ascent at the Phoenician - Camelback Reisdences
- 2 BR + Den Plan at Ascent at the Phoenician - Camelback Reisdences
- 3 BR + Den Plan at Ascent at the Phoenician - Camelback Reisdences
- 2 BR Plan at Ascent at the Phoenician - Camelback Reisdences
- 1 BR+Den Plan at Ascent at the Phoenician - Camelback Reisdences
- 5000 N Camelback Ridge Rd Unit 210
- 6142 E Alta Hacienda Dr
- 4544 N Evans Dr
- 4934 N Ascent Dr
- 4938 N Ascent Dr
- 5000 N Camelback Ridge Dr Unit 409
- 5000 N Camelback Ridge Dr Unit 304
- 4525 N 66th St Unit 78
- 4525 N 66th St Unit 95
- 4525 N 66th St Unit 57
- 6341 E Hillcrest Blvd
- 6326 E Alta Hacienda Dr
- 6341 E Alta Hacienda Dr
- 4601 N 64th St
- 6325 E Hillcrest Blvd
- 6335 E Alta Hacienda Dr
- 4541 N 64th St
- 4615 N 64th St
- 4627 N 64th St
- 6302 E Alta Hacienda Dr
- 6325 E Alta Hacienda Dr
- 6342 E Hillcrest Blvd
- 6301 E Hillcrest Blvd
- 6336 E Hillcrest Blvd
- 4527 N 64th St
- 6326 E Hillcrest Blvd
- 6301 E Alta Hacienda Dr
- 4515 N 64th St
- 6246 E Alta Hacienda Dr
- 6302 E Hillcrest Blvd