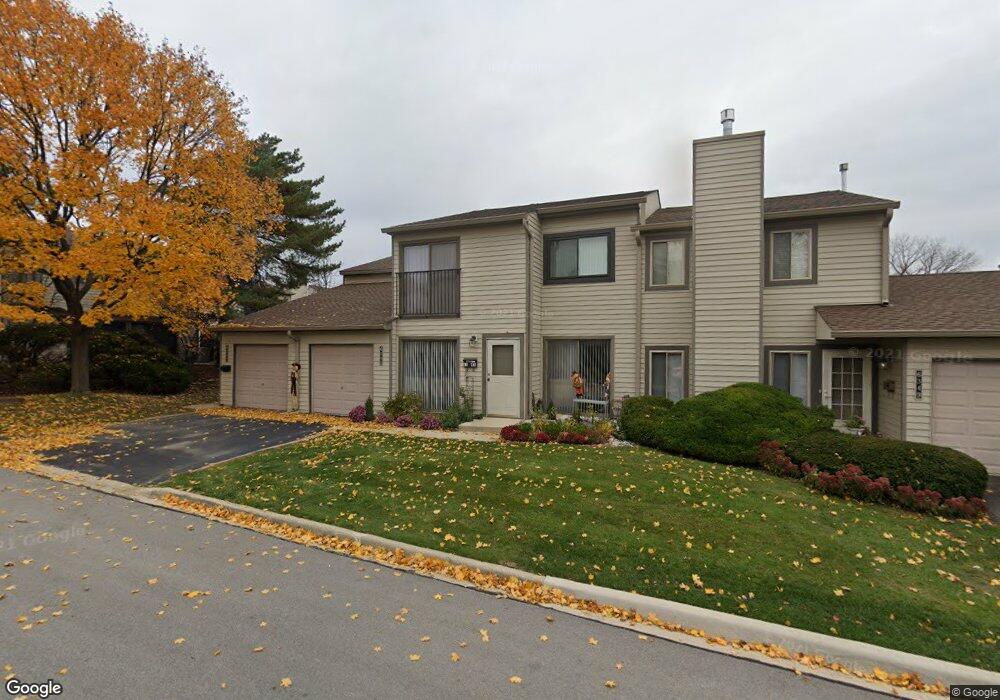
6343 Prideham St Unit 122 Downers Grove, IL 60516
South Downers Grove NeighborhoodEstimated Value: $328,000 - $340,000
3
Beds
2
Baths
1,344
Sq Ft
$247/Sq Ft
Est. Value
About This Home
This home is located at 6343 Prideham St Unit 122, Downers Grove, IL 60516 and is currently estimated at $331,836, approximately $246 per square foot. 6343 Prideham St Unit 122 is a home located in DuPage County with nearby schools including Indian Trail Elementary School, O'Neill Middle School, and Downers Grove South High School.
Ownership History
Date
Name
Owned For
Owner Type
Purchase Details
Closed on
May 31, 2016
Sold by
Detchevska Ivanka J
Bought by
Detchevska Ivanka and Detchevska Guenko P
Current Estimated Value
Purchase Details
Closed on
Aug 16, 2005
Sold by
Aziz Abbas and Aziz Abida
Bought by
Detchevska Ivan Ka
Home Financials for this Owner
Home Financials are based on the most recent Mortgage that was taken out on this home.
Original Mortgage
$175,200
Outstanding Balance
$93,626
Interest Rate
5.93%
Mortgage Type
New Conventional
Estimated Equity
$238,210
Purchase Details
Closed on
Jul 28, 1997
Sold by
Chay Betty J
Bought by
Aziz Abbas A and Aziz Abida
Home Financials for this Owner
Home Financials are based on the most recent Mortgage that was taken out on this home.
Original Mortgage
$94,125
Interest Rate
7.68%
Mortgage Type
Purchase Money Mortgage
Purchase Details
Closed on
Jun 30, 1994
Sold by
Mody Bhupendra M and Mody Yasmin B
Bought by
Chay Ed and Chay Betty J
Create a Home Valuation Report for This Property
The Home Valuation Report is an in-depth analysis detailing your home's value as well as a comparison with similar homes in the area
Home Values in the Area
Average Home Value in this Area
Purchase History
| Date | Buyer | Sale Price | Title Company |
|---|---|---|---|
| Detchevska Ivanka | -- | Attorney | |
| Detchevska Ivan Ka | $219,000 | Lawyers Title Ins | |
| Aziz Abbas A | $125,500 | Attorneys Title Guaranty Fun | |
| Chay Ed | $110,000 | Attorneys Title Guaranty Fun |
Source: Public Records
Mortgage History
| Date | Status | Borrower | Loan Amount |
|---|---|---|---|
| Open | Detchevska Ivan Ka | $175,200 | |
| Previous Owner | Aziz Abbas A | $94,125 |
Source: Public Records
Tax History Compared to Growth
Tax History
| Year | Tax Paid | Tax Assessment Tax Assessment Total Assessment is a certain percentage of the fair market value that is determined by local assessors to be the total taxable value of land and additions on the property. | Land | Improvement |
|---|---|---|---|---|
| 2024 | $3,877 | $75,722 | $20,494 | $55,228 |
| 2023 | $3,662 | $69,610 | $18,840 | $50,770 |
| 2022 | $3,620 | $67,510 | $18,270 | $49,240 |
| 2021 | $3,386 | $66,740 | $18,060 | $48,680 |
| 2020 | $3,320 | $65,420 | $17,700 | $47,720 |
| 2019 | $3,206 | $62,770 | $16,980 | $45,790 |
| 2018 | $3,300 | $63,730 | $17,240 | $46,490 |
| 2017 | $3,188 | $61,330 | $16,590 | $44,740 |
| 2016 | $3,115 | $58,530 | $15,830 | $42,700 |
| 2015 | $3,068 | $55,060 | $14,890 | $40,170 |
| 2014 | $3,284 | $56,950 | $15,400 | $41,550 |
| 2013 | $3,217 | $56,690 | $15,330 | $41,360 |
Source: Public Records
Map
Nearby Homes
- 6330 Prideham St Unit 138
- 1909 Bates Place
- 1974 Loomes Ave
- 1527 62nd St
- 6295 Woodward Ave
- Lot 22 Sherman Ave
- LOT 8 Margo Ct
- 6121 Woodward Ave
- 6154 Pershing Ave
- 2032 Wheeler St
- 6111 Dunham Rd
- 6651 Dunham Rd
- 6803 Penner Place
- 6325 Barrett St
- 1906 Concord Dr
- 5915 Pershing Ave
- 1135 Carol St
- 5760 Woodward Ave
- 1108 Carol St
- 6819 Prairieview Ave
- 1831 Breasted Ave Unit 75
- 6479 Nash St Unit 58
- 1804 Whidden Ave Unit 140
- 1808 Breasted Ave Unit 44
- 1800 Whidden Ave Unit 139
- 6354 Prideham St Unit 116
- 1728 Whidden Ave Unit 81
- 6366 Prideham St Unit 118
- 6360 Prideham St Unit 117
- 1741 Whidden Ave Unit 61
- 6349 Prideham St Unit 123
- 6410 Wells St Unit 17
- 6331 Wells St Unit 3
- 1713 Breasted Ave Unit 21
- 6360 Hathaway Ln Unit 102
- 6401 Wells St Unit 12
- 1769 Breasted Ave Unit 38
- 1745 Whidden Ave Unit 60
- 6418 Prideham St Unit 112
- 6435 Nash St Unit 50