Estimated Value: $312,106 - $352,000
3
Beds
3
Baths
1,564
Sq Ft
$210/Sq Ft
Est. Value
About This Home
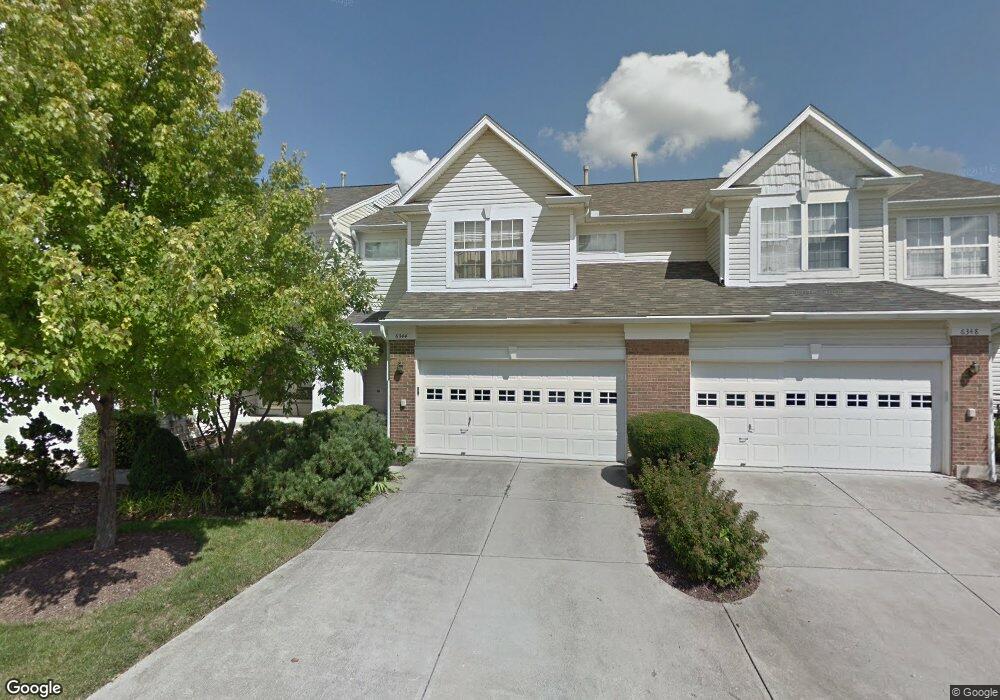
This home is located at 6344 Inverness Way, Mason, OH 45040 and is currently estimated at $329,027, approximately $210 per square foot. 6344 Inverness Way is a home located in Warren County with nearby schools including Kings Junior High School, Kings High School, and Mars Hill Academy.
Ownership History
Date
Name
Owned For
Owner Type
Purchase Details
Closed on
Jul 29, 2010
Sold by
Porter Stolie Kathleen
Bought by
Kline Linda G
Current Estimated Value
Home Financials for this Owner
Home Financials are based on the most recent Mortgage that was taken out on this home.
Original Mortgage
$72,500
Interest Rate
4.45%
Mortgage Type
New Conventional
Purchase Details
Closed on
Dec 8, 2000
Sold by
Holder Susan
Bought by
Stolle Kathleen P and Kline Linda G
Home Financials for this Owner
Home Financials are based on the most recent Mortgage that was taken out on this home.
Original Mortgage
$100,800
Interest Rate
7.87%
Mortgage Type
New Conventional
Purchase Details
Closed on
Apr 3, 1998
Sold by
Quintana John B
Bought by
Holder Susan W
Purchase Details
Closed on
Jan 2, 1997
Sold by
Ryland Group Inc
Bought by
Quintana John B and Quintana Michelle L
Home Financials for this Owner
Home Financials are based on the most recent Mortgage that was taken out on this home.
Original Mortgage
$118,400
Interest Rate
7.6%
Mortgage Type
FHA
Create a Home Valuation Report for This Property
The Home Valuation Report is an in-depth analysis detailing your home's value as well as a comparison with similar homes in the area
Home Values in the Area
Average Home Value in this Area
Purchase History
| Date | Buyer | Sale Price | Title Company |
|---|---|---|---|
| Kline Linda G | -- | Monarch Title Svcs Of Oh Llc | |
| Stolle Kathleen P | $126,000 | -- | |
| Holder Susan W | $128,500 | -- | |
| Quintana John B | $121,125 | -- |
Source: Public Records
Mortgage History
| Date | Status | Borrower | Loan Amount |
|---|---|---|---|
| Previous Owner | Kline Linda G | $72,500 | |
| Previous Owner | Stolle Kathleen P | $100,800 | |
| Previous Owner | Quintana John B | $118,400 | |
| Closed | Holder Susan W | -- |
Source: Public Records
Tax History Compared to Growth
Tax History
| Year | Tax Paid | Tax Assessment Tax Assessment Total Assessment is a certain percentage of the fair market value that is determined by local assessors to be the total taxable value of land and additions on the property. | Land | Improvement |
|---|---|---|---|---|
| 2024 | $4,261 | $85,800 | $26,950 | $58,850 |
| 2023 | $3,474 | $64,452 | $14,455 | $49,997 |
| 2022 | $3,433 | $64,453 | $14,455 | $49,998 |
| 2021 | $2,836 | $64,453 | $14,455 | $49,998 |
| 2020 | $2,831 | $54,621 | $12,250 | $42,371 |
| 2019 | $2,870 | $54,621 | $12,250 | $42,371 |
| 2018 | $2,876 | $54,621 | $12,250 | $42,371 |
| 2017 | $2,753 | $47,016 | $10,707 | $36,309 |
| 2016 | $2,828 | $47,016 | $10,707 | $36,309 |
| 2015 | $2,548 | $47,016 | $10,707 | $36,309 |
| 2014 | $2,505 | $43,940 | $10,010 | $33,930 |
| 2013 | $2,508 | $53,780 | $12,250 | $41,530 |
Source: Public Records
Map
Nearby Homes
- 6416 Inverness Way
- 6486 Prestwick Ct
- 6309 Inverness Way
- 6415 Eagleview Dr
- 6572 Eagle View Dr
- 6521 Grand Cypress Way
- 6394 Grand Cypress Way
- 6534 Turtle Point Place
- 711 Eagle View Ct
- 4087 Fieldsedge Dr Unit 285E
- 4154 Fieldsedge Dr
- 3900 St Andrews Ct
- 6668 Pondfield Ln
- 4109 Old Manchester Ct
- 5799 Fairway Dr
- 6674 Villager Place Unit 153D
- 618 Bunker Ln
- 550 Maple Ln
- 400 Walnut Ln
- 6550 Villagefield Dr
- 6348 Inverness Way
- 6340 Inverness Way
- 6336 Inverness Way
- 6358 Inverness Way
- 3684 Oakmont Ct
- 6362 Inverness Way
- 3678 Oakmont Ct
- 6345 Inverness Way
- 6366 Inverness Way
- 6337 Inverness Way
- 6341 Inverness Way
- 6333 Inverness Way
- 3674 Oakmont Ct
- 3674 Oakmount Ct
- 6329 Inverness Way
- 3691 Oakmont Ct
- 3691 Oakmount Ct
- 6325 Inverness Way
- 6370 Inverness Way
- 6351 Inverness Way