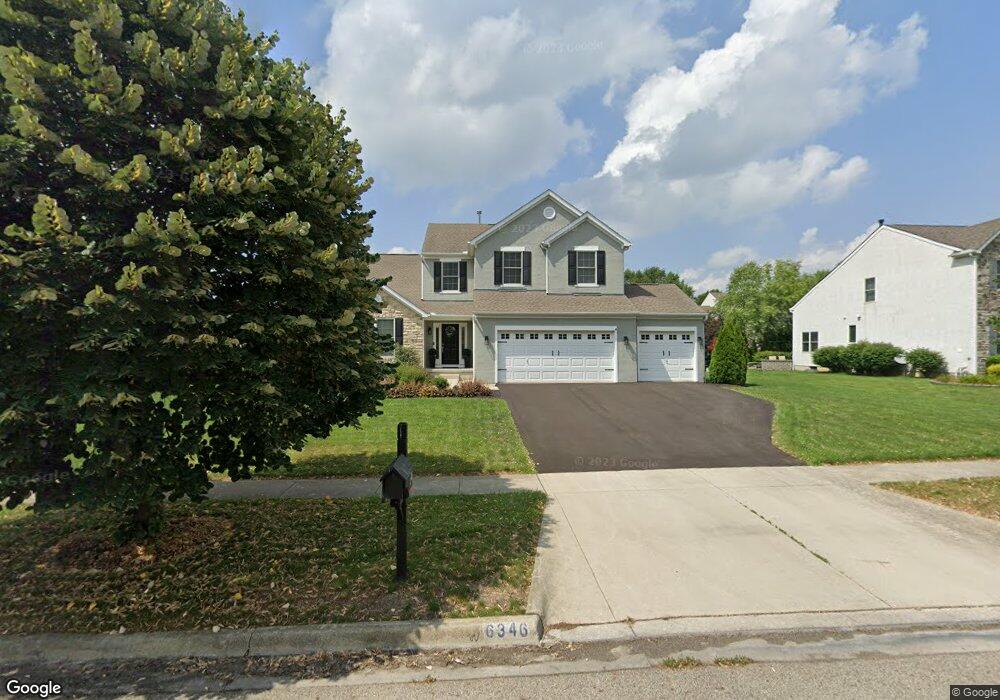
6346 Jeffrelyn Dr Unit 96 Hilliard, OH 43026
Estimated Value: $589,000 - $613,000
4
Beds
4
Baths
2,742
Sq Ft
$219/Sq Ft
Est. Value
About This Home
This home is located at 6346 Jeffrelyn Dr Unit 96, Hilliard, OH 43026 and is currently estimated at $601,021, approximately $219 per square foot. 6346 Jeffrelyn Dr Unit 96 is a home located in Franklin County with nearby schools including Hoffman Trails Elementary School, Hilliard Station Sixth Grade Elementary School, and Hilliard Heritage Middle School.
Ownership History
Date
Name
Owned For
Owner Type
Purchase Details
Closed on
Jun 14, 2022
Sold by
Monroe Arin L and Monroe Katherine F
Bought by
Zantopulos Adam J and Zantopulos Sara K
Current Estimated Value
Home Financials for this Owner
Home Financials are based on the most recent Mortgage that was taken out on this home.
Original Mortgage
$420,000
Outstanding Balance
$399,562
Interest Rate
5.25%
Mortgage Type
New Conventional
Estimated Equity
$201,459
Purchase Details
Closed on
May 12, 2006
Sold by
Dominion Homes Inc
Bought by
Monroe Arin L and Monroe Katherine F
Home Financials for this Owner
Home Financials are based on the most recent Mortgage that was taken out on this home.
Original Mortgage
$261,180
Interest Rate
6.54%
Mortgage Type
Fannie Mae Freddie Mac
Create a Home Valuation Report for This Property
The Home Valuation Report is an in-depth analysis detailing your home's value as well as a comparison with similar homes in the area
Home Values in the Area
Average Home Value in this Area
Purchase History
| Date | Buyer | Sale Price | Title Company |
|---|---|---|---|
| Zantopulos Adam J | $560,000 | Pm Title | |
| Monroe Arin L | $326,500 | Alliance Ti |
Source: Public Records
Mortgage History
| Date | Status | Borrower | Loan Amount |
|---|---|---|---|
| Open | Zantopulos Adam J | $420,000 | |
| Previous Owner | Monroe Arin L | $261,180 |
Source: Public Records
Tax History Compared to Growth
Tax History
| Year | Tax Paid | Tax Assessment Tax Assessment Total Assessment is a certain percentage of the fair market value that is determined by local assessors to be the total taxable value of land and additions on the property. | Land | Improvement |
|---|---|---|---|---|
| 2024 | $11,007 | $164,330 | $41,650 | $122,680 |
| 2023 | $8,963 | $164,330 | $41,650 | $122,680 |
| 2022 | $9,079 | $132,480 | $39,730 | $92,750 |
| 2021 | $9,073 | $132,480 | $39,730 | $92,750 |
| 2020 | $9,050 | $132,480 | $39,730 | $92,750 |
| 2019 | $9,139 | $113,860 | $34,550 | $79,310 |
| 2018 | $8,787 | $113,860 | $34,550 | $79,310 |
| 2017 | $9,035 | $113,860 | $34,550 | $79,310 |
| 2016 | $8,965 | $103,780 | $22,020 | $81,760 |
| 2015 | $8,467 | $103,780 | $22,020 | $81,760 |
| 2014 | $8,482 | $103,780 | $22,020 | $81,760 |
| 2013 | $4,099 | $98,840 | $20,965 | $77,875 |
Source: Public Records
Map
Nearby Homes
- 6223 Pollard Place Dr
- 6451 Whitewater Way
- 6172 Ray's Way Unit 19
- 6185 Ray's Way
- 5994 Farmcreek Ct
- 6674 Cat Singer Cir S
- 6228 Parkmeadow Ln
- 6504 Shadewater Dr
- 6110 Parkmeadow Ln
- 5935 Pondview Ct
- Ashland Plan at Tarlton Meadows
- Richmond Plan at Tarlton Meadows
- Barclay Plan at Tarlton Meadows
- Linden Plan at Tarlton Meadows
- Rockingham Plan at Tarlton Meadows
- Charleston Plan at Tarlton Meadows
- Dover Plan at Tarlton Meadows
- Alder Plan at Tarlton Meadows
- Bradford Plan at Tarlton Meadows
- Brentwood Plan at Tarlton Meadows
- 6346 Jeffrelyn Dr
- 6332 Jeffrelyn Dr
- 6364 Jeffrelyn Dr
- 6349 Debidare Ct
- 6349 Debidare Ct Unit 132
- 6339 Debidare Ct
- 6365 Debidare Ct
- 6347 Jeffrelyn Dr
- 6320 Jeffrelyn Dr
- 6320 Jeffrelyn Dr Unit 98
- 6333 Jeffrelyn Dr
- 6363 Jeffrelyn Dr
- 6327 Debidare Ct
- 6308 Jeffrelyn Dr
- 6308 Jeffrelyn Dr Unit 99
- 6350 Debidare Ct
- 6315 Debidare Ct
- 6340 Debidare Ct
- 6340 Debidare Ct Unit 136
- 6336 Carriann Ct