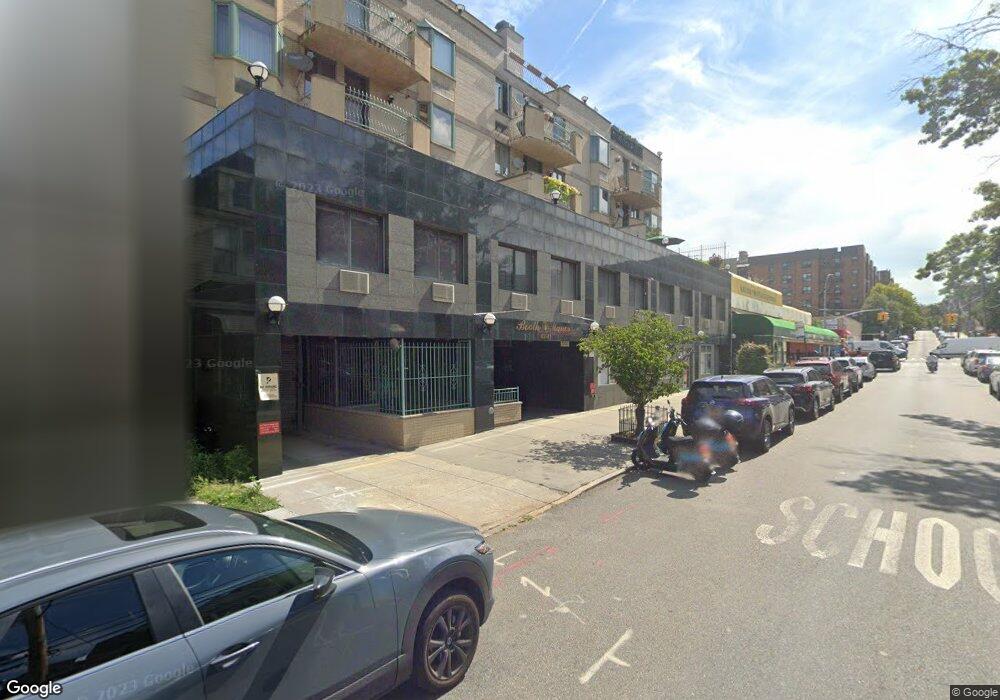
6347 Booth St Unit 6D Rego Park, NY 11374
Rego Park NeighborhoodEstimated Value: $369,000 - $498,637
--
Bed
--
Bath
693
Sq Ft
$636/Sq Ft
Est. Value
About This Home
This home is located at 6347 Booth St Unit 6D, Rego Park, NY 11374 and is currently estimated at $440,909, approximately $636 per square foot. 6347 Booth St Unit 6D is a home located in Queens County with nearby schools including P.S. 139 Rego Park, J.H.S. 190 Russell Sage, and Valence College Preparatory Charter School.
Ownership History
Date
Name
Owned For
Owner Type
Purchase Details
Closed on
Aug 15, 2014
Sold by
Juan A Leon As Admin Of The Rafael M
Bought by
Wai Galaxi and Wai Wendy
Current Estimated Value
Purchase Details
Closed on
Oct 18, 2005
Sold by
Hua Dan
Bought by
Leon Rafael
Purchase Details
Closed on
Sep 25, 2002
Sold by
Hua Dan and Oiu Yilong
Bought by
Hua Dan
Home Financials for this Owner
Home Financials are based on the most recent Mortgage that was taken out on this home.
Original Mortgage
$50
Interest Rate
6.03%
Purchase Details
Closed on
May 18, 2001
Sold by
Fultonex International
Bought by
Hua Dan and Liu Yilong
Home Financials for this Owner
Home Financials are based on the most recent Mortgage that was taken out on this home.
Original Mortgage
$127,000
Interest Rate
7.09%
Create a Home Valuation Report for This Property
The Home Valuation Report is an in-depth analysis detailing your home's value as well as a comparison with similar homes in the area
Home Values in the Area
Average Home Value in this Area
Purchase History
| Date | Buyer | Sale Price | Title Company |
|---|---|---|---|
| Wai Galaxi | $323,000 | -- | |
| Wai Galaxi | $323,000 | -- | |
| Leon Rafael | $325,000 | -- | |
| Leon Rafael | $325,000 | -- | |
| Hua Dan | -- | -- | |
| Hua Dan | -- | -- | |
| Hua Dan | -- | -- | |
| Hua Dan | -- | -- |
Source: Public Records
Mortgage History
| Date | Status | Borrower | Loan Amount |
|---|---|---|---|
| Previous Owner | Hua Dan | $50 | |
| Previous Owner | Hua Dan | $127,000 | |
| Closed | Hua Dan | $0 |
Source: Public Records
Tax History Compared to Growth
Tax History
| Year | Tax Paid | Tax Assessment Tax Assessment Total Assessment is a certain percentage of the fair market value that is determined by local assessors to be the total taxable value of land and additions on the property. | Land | Improvement |
|---|---|---|---|---|
| 2025 | $6,364 | $52,810 | $6,833 | $45,977 |
| 2024 | $6,385 | $53,223 | $6,833 | $46,390 |
| 2023 | $6,334 | $52,983 | $6,833 | $46,150 |
| 2022 | $2,823 | $48,523 | $6,833 | $41,690 |
| 2021 | $5,661 | $48,523 | $6,833 | $41,690 |
| 2020 | $6,552 | $55,214 | $6,833 | $48,381 |
| 2019 | $6,627 | $56,757 | $6,833 | $49,924 |
| 2018 | $6,827 | $56,005 | $3,248 | $52,757 |
| 2017 | $5,726 | $52,405 | $3,247 | $49,158 |
| 2016 | $7,731 | $52,405 | $3,247 | $49,158 |
| 2015 | $1,265 | $59,456 | $3,247 | $56,209 |
| 2014 | $1,265 | $56,064 | $3,248 | $52,816 |
Source: Public Records
Map
Nearby Homes
- 63-45 Saunders St Unit 3G
- 63-45 Saunders St Unit 5-G
- 63-45 Saunders St Unit 2D
- 63-88 Wetherole St
- 6395 Austin St Unit 2F
- 63-84 Saunders St Unit 2G
- 63-95 Austin St Unit 2C
- 63-95 Austin St Unit 6G
- 6518 Austin St Unit 2B
- 6518 Austin St Unit 2J
- 63-89 Saunders St Unit 2B
- 63-89 Saunders St Unit 6-C
- 62-64 Saunders St Unit 4P
- 62-64 Saunders St Unit D2
- 6264 Saunders St Unit 1A
- 63-109 Saunders St Unit 3A
- 63-109 Saunders St Unit A11
- 62-66 Austin St
- 94-10 64th Rd Unit B6
- 94-10 64th Rd Unit C1
- 63-47 Booth St Unit 5 C
- 6347 Booth St Unit 7C
- 6347 Booth St Unit 7B
- 6347 Booth St Unit 7A
- 6347 Booth St Unit 6F
- 6347 Booth St Unit 6E
- 6347 Booth St Unit 6C
- 6347 Booth St Unit 6B
- 6347 Booth St Unit 6A
- 6347 Booth St Unit 5F
- 6347 Booth St Unit 5E
- 6347 Booth St Unit 5D
- 6347 Booth St Unit 5C
- 6347 Booth St Unit 5B
- 6347 Booth St Unit 5A
- 6347 Booth St Unit 3F
- 6347 Booth St Unit 3E
- 6347 Booth St Unit 3D
- 6347 Booth St Unit 3C
- 6347 Booth St Unit 3B