Estimated Value: $224,514 - $283,000
3
Beds
2
Baths
1,852
Sq Ft
$139/Sq Ft
Est. Value
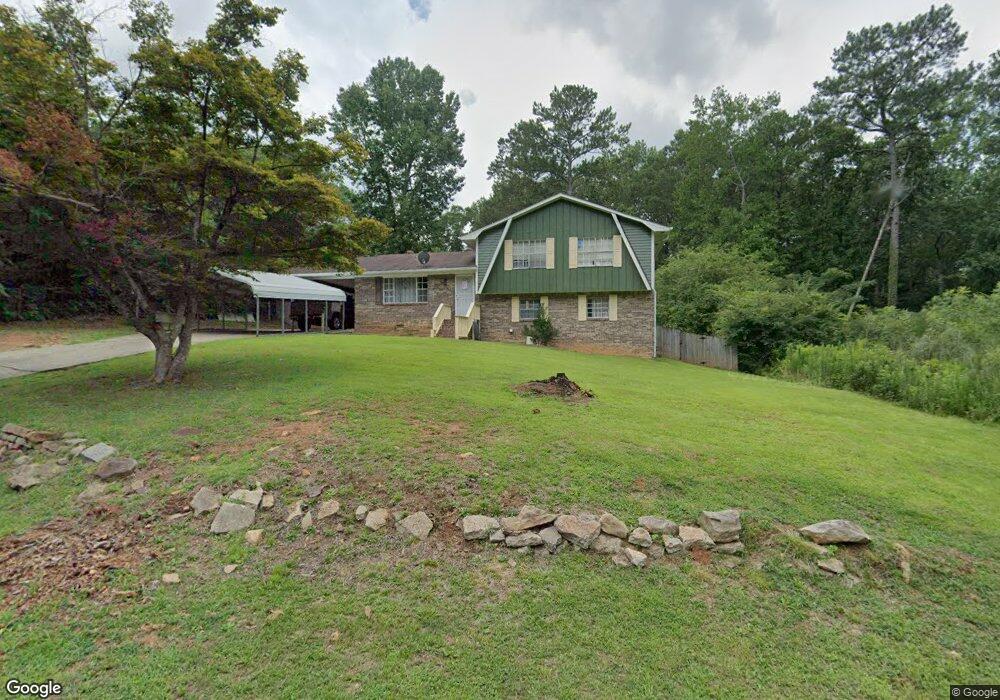
About This Home
This home is located at 6349 Alpine Rd, Rex, GA 30273 and is currently estimated at $257,129, approximately $138 per square foot. 6349 Alpine Rd is a home located in Clayton County with nearby schools including Roberta T. Smith Elementary School, Rex Mill Middle School, and Morrow High School.
Ownership History
Date
Name
Owned For
Owner Type
Purchase Details
Closed on
Dec 16, 2020
Sold by
Huynh Thuy Trang Thi
Bought by
Huynh Thuy Trang Thi and Ibarra Dulce Maria
Current Estimated Value
Purchase Details
Closed on
Sep 4, 2020
Sold by
Vanpham Tuan Van
Bought by
Huynh Thuy Trang Thi
Purchase Details
Closed on
May 12, 2018
Sold by
Vanvanpham Tuan Van
Bought by
Huynh Thuy Trang Thi and Pham Tuan Van
Purchase Details
Closed on
Sep 12, 2015
Sold by
Debenture Investments Llc
Bought by
Vanvanpham Ruan Van
Purchase Details
Closed on
Jul 3, 2012
Sold by
Hunter Samuel
Bought by
Debenture Investments Llc
Purchase Details
Closed on
Nov 21, 2001
Sold by
Mullen James J
Bought by
Hunter Samuel
Home Financials for this Owner
Home Financials are based on the most recent Mortgage that was taken out on this home.
Original Mortgage
$121,246
Interest Rate
6.6%
Mortgage Type
FHA
Create a Home Valuation Report for This Property
The Home Valuation Report is an in-depth analysis detailing your home's value as well as a comparison with similar homes in the area
Home Values in the Area
Average Home Value in this Area
Purchase History
| Date | Buyer | Sale Price | Title Company |
|---|---|---|---|
| Huynh Thuy Trang Thi | -- | -- | |
| Huynh Thuy Trang Thi | -- | -- | |
| Huynh Thuy Trang Thi | -- | -- | |
| Vanvanpham Ruan Van | $15,500 | -- | |
| Debenture Investments Llc | $6,000 | -- | |
| Hunter Samuel | $123,200 | -- |
Source: Public Records
Mortgage History
| Date | Status | Borrower | Loan Amount |
|---|---|---|---|
| Previous Owner | Hunter Samuel | $121,246 |
Source: Public Records
Tax History
| Year | Tax Paid | Tax Assessment Tax Assessment Total Assessment is a certain percentage of the fair market value that is determined by local assessors to be the total taxable value of land and additions on the property. | Land | Improvement |
|---|---|---|---|---|
| 2025 | $2,769 | $81,400 | $8,000 | $73,400 |
| 2024 | $2,646 | $76,920 | $8,000 | $68,920 |
| 2023 | $2,747 | $75,120 | $8,000 | $67,120 |
| 2022 | $2,501 | $62,840 | $8,000 | $54,840 |
| 2021 | $1,793 | $44,520 | $8,000 | $36,520 |
| 2020 | $1,616 | $39,542 | $8,000 | $31,542 |
| 2019 | $1,549 | $37,288 | $6,400 | $30,888 |
| 2018 | $1,471 | $35,366 | $6,400 | $28,966 |
| 2017 | $1,348 | $32,267 | $6,400 | $25,867 |
| 2016 | $1,363 | $32,642 | $6,400 | $26,242 |
| 2015 | $1,356 | $0 | $0 | $0 |
| 2014 | $1,356 | $33,201 | $7,200 | $26,001 |
Source: Public Records
Map
Nearby Homes
- 100 Homestead Place
- 85 Homestead Place
- 6435 Cumberland Dr
- 3712 Skyline Place
- 6683 Homestead Rd
- 3824 Augustine Place
- 6814 Biscayne
- 6132 Christopher Terrace Unit 3
- 6320 Headwaters Way
- 6661 Highway 42
- 6247 Ellenwood Dr
- 3645 Fay Dr Unit 1
- 6258 Ellenwood Dr
- 6257 Ellenwood Dr
- 6670 Sunset Hills Blvd
- 6604 Chesepeake Trail
- 6608 Chesepeake Trail
- 3769 Brookwood Blvd
- 6103 Chaseland Rd
- 6103 Chaseland Dr
- 6365 Alpine Rd
- 6370 Woodlawn Ave
- 6344 Alpine Rd
- 6374 Woodlawn Ave
- 6358 Alpine Rd
- 6375 Alpine Rd
- 6380 Woodlawn Ave
- 6368 Alpine Rd
- 6387 Alpine Rd
- 6386 Woodlawn Ave
- 6364 Woodlawn Ave
- 6357 Cumberland Dr
- 3888 Homestead Place
- 6397 Alpine Rd
- 6365 Cumberland Dr
- 6331 Cumberland Dr
- 6396 Woodlawn Ave
- 6372 Woodlawn Ave
- 6377 Cumberland Dr
- 6321 Cumberland Dr
Your Personal Tour Guide
Ask me questions while you tour the home.