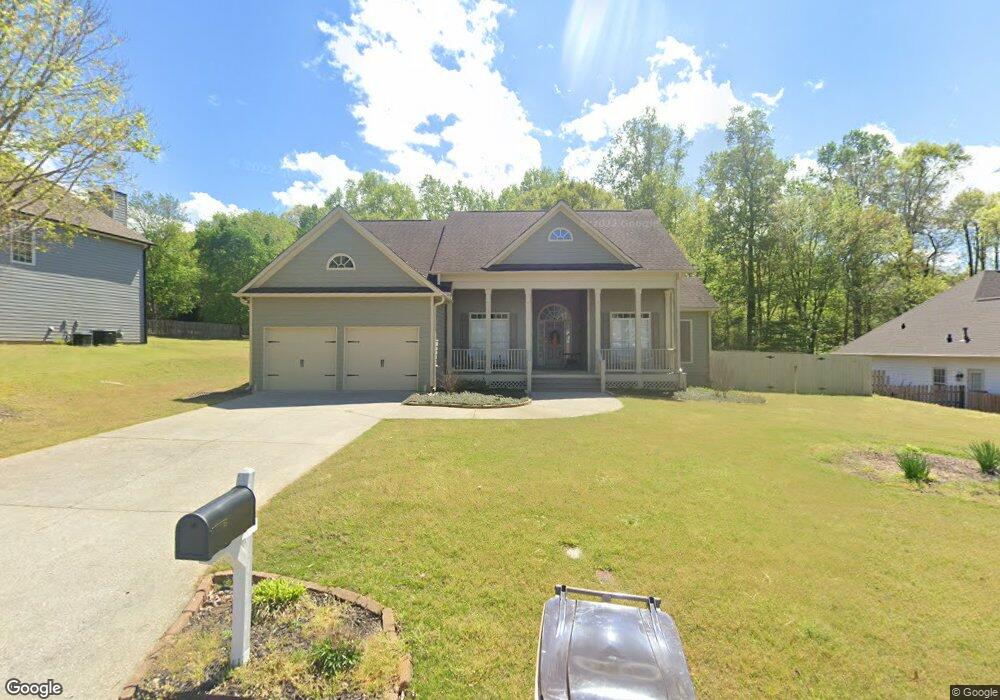
6349 Spring Lake Dr Flowery Branch, GA 30542
Estimated Value: $447,075 - $504,000
4
Beds
3
Baths
2,216
Sq Ft
$219/Sq Ft
Est. Value
About This Home
This home is located at 6349 Spring Lake Dr, Flowery Branch, GA 30542 and is currently estimated at $486,019, approximately $219 per square foot. 6349 Spring Lake Dr is a home located in Hall County with nearby schools including Flowery Branch Elementary School, West Hall Middle School, and West Hall High School.
Ownership History
Date
Name
Owned For
Owner Type
Purchase Details
Closed on
Jun 23, 2022
Sold by
Sfr Investments V Borrower 1 Llc
Bought by
Progress Residential Borrower 20 Llc
Current Estimated Value
Purchase Details
Closed on
Dec 17, 2021
Sold by
Zillow Homes Property Trust
Bought by
Sfr Investments V Borrower 1 Llc
Purchase Details
Closed on
Oct 5, 2021
Sold by
Deane Laura L
Bought by
Zillow Homes Property Tr
Purchase Details
Closed on
Dec 12, 2017
Sold by
Deane Laura L
Bought by
Deane Laura L and Montero Megan
Home Financials for this Owner
Home Financials are based on the most recent Mortgage that was taken out on this home.
Original Mortgage
$216,727
Interest Rate
3.87%
Mortgage Type
FHA
Purchase Details
Closed on
Jun 29, 2005
Sold by
Morris Michael A
Bought by
Morris Linda G
Purchase Details
Closed on
Nov 25, 1996
Sold by
Lakeside Homebldrs Llc
Bought by
Morris Michael A
Purchase Details
Closed on
Aug 1, 1996
Create a Home Valuation Report for This Property
The Home Valuation Report is an in-depth analysis detailing your home's value as well as a comparison with similar homes in the area
Home Values in the Area
Average Home Value in this Area
Purchase History
| Date | Buyer | Sale Price | Title Company |
|---|---|---|---|
| Progress Residential Borrower 20 Llc | -- | -- | |
| Sfr Investments V Borrower 1 Llc | $896,298 | -- | |
| Zillow Homes Property Tr | $425,840 | -- | |
| Deane Laura L | -- | -- | |
| Morris Linda G | $170,000 | -- | |
| Morris Michael A | $144,200 | -- | |
| -- | $212,000 | -- |
Source: Public Records
Mortgage History
| Date | Status | Borrower | Loan Amount |
|---|---|---|---|
| Previous Owner | Deane Laura L | $216,727 | |
| Closed | Morris Michael A | $0 |
Source: Public Records
Tax History Compared to Growth
Tax History
| Year | Tax Paid | Tax Assessment Tax Assessment Total Assessment is a certain percentage of the fair market value that is determined by local assessors to be the total taxable value of land and additions on the property. | Land | Improvement |
|---|---|---|---|---|
| 2024 | $4,369 | $174,040 | $30,080 | $143,960 |
| 2023 | $3,695 | $185,680 | $29,760 | $155,920 |
| 2022 | $3,849 | $146,720 | $27,080 | $119,640 |
| 2021 | $2,628 | $99,360 | $18,160 | $81,200 |
| 2020 | $2,348 | $86,200 | $12,080 | $74,120 |
| 2019 | $2,597 | $94,600 | $14,640 | $79,960 |
| 2018 | $2,407 | $84,840 | $15,120 | $69,720 |
| 2017 | $2,307 | $82,160 | $12,120 | $70,040 |
| 2016 | $2,120 | $77,280 | $12,920 | $64,360 |
| 2015 | $1,947 | $70,360 | $11,720 | $58,640 |
| 2014 | $1,947 | $70,360 | $11,720 | $58,640 |
Source: Public Records
Map
Nearby Homes
- 6416 Deep Woods Ct
- 6414 Deep Valley Ct Unit 14081408
- 6308 Chestnut Hill Rd
- 6428 Paradise Point Rd
- 6280 Oakleaf Dr
- 6441 Wildwood Trail
- 6567 Tahiti Way
- 6498 Wildwood Trail
- SUDBURY 24' TOWNHOME Plan at Waypoint
- ADDINGTON Plan at Waypoint
- SALISBURY 24' TOWNHOME Plan at Waypoint
- AMESBURY Plan at Waypoint
- 6660 Parsons St
- 6262 Laurel Wood Trail
- 6749 Leigh St
- 6740 Leigh St
- 6343 Spring Lake Dr
- 6355 Spring Lake Dr
- 6337 Spring Lake Dr
- 6352 Spring Lake Dr
- 6367 Spring Lake Dr
- 6367 Spring Lake Dr Unit 3/69
- 6361 Spring Lake Dr
- 6358 Spring Lake Dr
- 6348 Spring Lake Dr
- 6422 Deep Woods Ct
- 6331 Spring Lake Dr
- 6364 Spring Lake Dr
- 6370 Spring Lake Dr
- 6342 Spring Lake Dr Unit 63
- 6342 Spring Lake Dr
- 6428 Deep Woods Ct
- 0 Deep Woods Ct Unit 8856686
- 0 Deep Woods Ct Unit 8856693
- 0 Deep Woods Ct Unit 7207296
- 0 Deep Woods Ct Unit 7164636