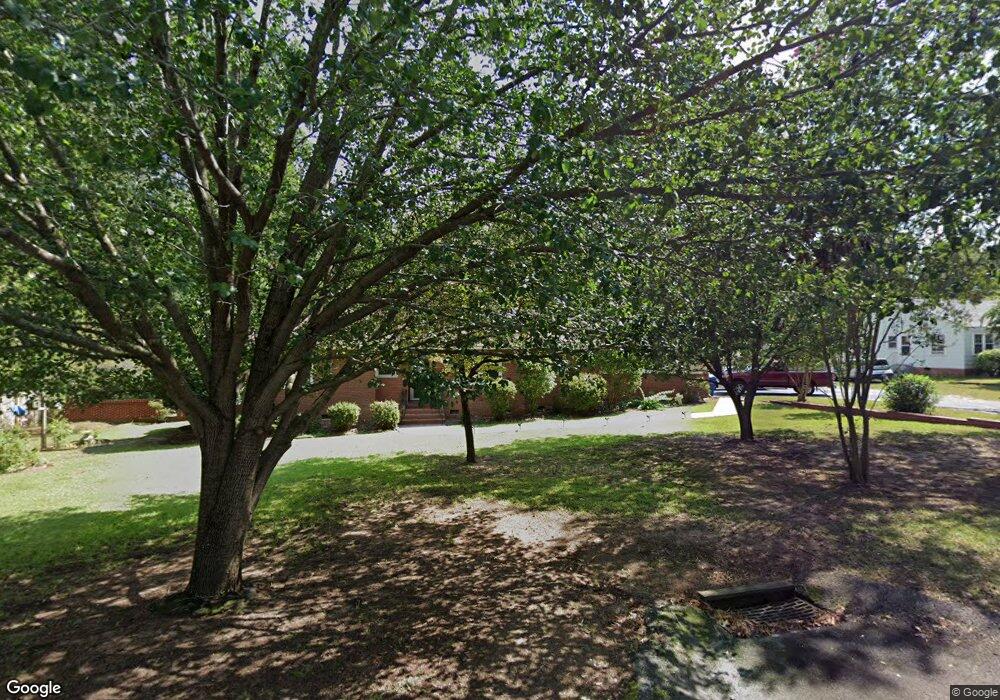
635 C Ave West Columbia, SC 29169
Estimated Value: $315,000 - $457,000
3
Beds
2
Baths
2,150
Sq Ft
$167/Sq Ft
Est. Value
About This Home
This home is located at 635 C Ave, West Columbia, SC 29169 and is currently estimated at $359,128, approximately $167 per square foot. 635 C Ave is a home with nearby schools including Cayce Elementary, Cyril B. Busbee Creative Arts Academy, and Brookland-Cayce High School.
Ownership History
Date
Name
Owned For
Owner Type
Purchase Details
Closed on
Feb 21, 2020
Sold by
Essex Home Southeast Inc
Bought by
Thigpen Clarence and Thigpen Zola
Current Estimated Value
Home Financials for this Owner
Home Financials are based on the most recent Mortgage that was taken out on this home.
Original Mortgage
$210,738
Outstanding Balance
$186,594
Interest Rate
3.6%
Mortgage Type
VA
Estimated Equity
$172,534
Create a Home Valuation Report for This Property
The Home Valuation Report is an in-depth analysis detailing your home's value as well as a comparison with similar homes in the area
Home Values in the Area
Average Home Value in this Area
Purchase History
| Date | Buyer | Sale Price | Title Company |
|---|---|---|---|
| Thigpen Clarence | $206,000 | None Available |
Source: Public Records
Mortgage History
| Date | Status | Borrower | Loan Amount |
|---|---|---|---|
| Open | Thigpen Clarence | $210,738 |
Source: Public Records
Tax History Compared to Growth
Tax History
| Year | Tax Paid | Tax Assessment Tax Assessment Total Assessment is a certain percentage of the fair market value that is determined by local assessors to be the total taxable value of land and additions on the property. | Land | Improvement |
|---|---|---|---|---|
| 2024 | $1,334 | $6,293 | $2,200 | $4,093 |
| 2023 | $1,202 | $6,293 | $2,200 | $4,093 |
| 2022 | $1,214 | $6,293 | $2,200 | $4,093 |
| 2020 | $1,166 | $6,293 | $2,200 | $4,093 |
| 2019 | $1,078 | $5,698 | $2,040 | $3,658 |
| 2018 | $1,089 | $5,698 | $2,040 | $3,658 |
| 2017 | $1,045 | $5,698 | $2,040 | $3,658 |
| 2016 | $1,075 | $5,698 | $2,040 | $3,658 |
| 2014 | $862 | $6,010 | $2,040 | $3,970 |
| 2013 | -- | $6,010 | $2,040 | $3,970 |
Source: Public Records
Map
Nearby Homes
- 315 Herman St
- 214 Saint Anns Alley
- 515 Center St
- 908 B Ave
- 101 Shuler St
- 706 Violet St
- 1011 D Ave
- 827 Indigo Ave
- 928 Indigo Ave
- 120 River Flow Ct
- 100 River Flow Ct
- 100 Sunset Blvd Unit 401
- 613 Lafayette Ave
- 1249 Jessamine St
- 1041 Indigo Ave
- 1224 Evergreen Ave
- 611 Naples Ave
- Tract 1 Hallelujah Rd
- 502A Koon St
- 1015 Naples Ave