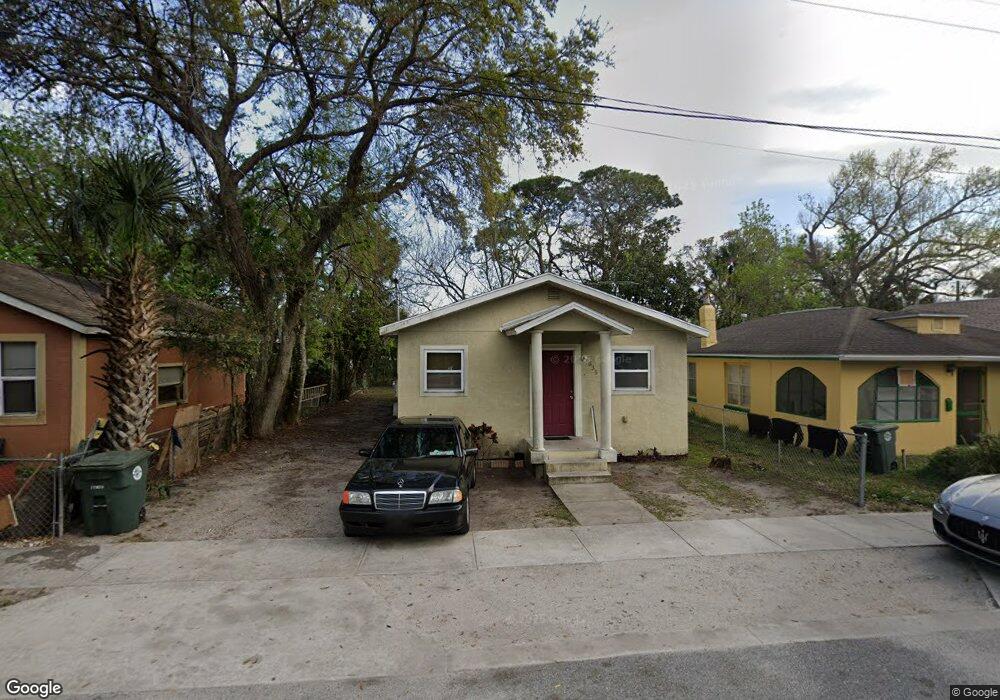
635 Cherry St Daytona Beach, FL 32114
Central Daytona NeighborhoodEstimated Value: $171,000 - $210,000
4
Beds
2
Baths
1,058
Sq Ft
$180/Sq Ft
Est. Value
About This Home
This home is located at 635 Cherry St, Daytona Beach, FL 32114 and is currently estimated at $190,639, approximately $180 per square foot. 635 Cherry St is a home located in Volusia County with nearby schools including Turie T. Small Elementary School, Campbell Middle School, and Spruce Creek High School.
Ownership History
Date
Name
Owned For
Owner Type
Purchase Details
Closed on
Sep 16, 2024
Sold by
Richardson Andre B
Bought by
Richardson Andre B and Morgan Eric
Current Estimated Value
Purchase Details
Closed on
Mar 16, 2023
Sold by
Morgan Erie
Bought by
Richardson Andre B
Home Financials for this Owner
Home Financials are based on the most recent Mortgage that was taken out on this home.
Original Mortgage
$152,250
Interest Rate
6.12%
Mortgage Type
New Conventional
Purchase Details
Closed on
Oct 5, 2016
Sold by
Richardson Andre B
Bought by
Morgan Eric and Chatman Monique Richardson
Purchase Details
Closed on
Sep 26, 2016
Sold by
Richardson Andre B
Bought by
Morgan Eric and Chatman Monique Richardson
Purchase Details
Closed on
Aug 27, 2015
Sold by
Pittman Gladys D
Bought by
Richardson Andre
Purchase Details
Closed on
Feb 26, 2015
Sold by
Floyd Glorie
Bought by
Richardson Andre
Purchase Details
Closed on
Sep 27, 2012
Sold by
Williams Dorothy
Bought by
Floyd Gloria
Purchase Details
Closed on
Feb 15, 1976
Bought by
Richardson Andre B
Create a Home Valuation Report for This Property
The Home Valuation Report is an in-depth analysis detailing your home's value as well as a comparison with similar homes in the area
Home Values in the Area
Average Home Value in this Area
Purchase History
| Date | Buyer | Sale Price | Title Company |
|---|---|---|---|
| Richardson Andre B | -- | None Listed On Document | |
| Richardson Andre B | $100 | None Listed On Document | |
| Morgan Eric | -- | Attorney | |
| Morgan Eric | -- | Attorney | |
| Richardson Andre | -- | None Available | |
| Richardson Andre | $6,250 | None Available | |
| Floyd Gloria | -- | None Available | |
| Richardson Andre B | $2,800 | -- |
Source: Public Records
Mortgage History
| Date | Status | Borrower | Loan Amount |
|---|---|---|---|
| Previous Owner | Richardson Andre B | $152,250 |
Source: Public Records
Tax History
| Year | Tax Paid | Tax Assessment Tax Assessment Total Assessment is a certain percentage of the fair market value that is determined by local assessors to be the total taxable value of land and additions on the property. | Land | Improvement |
|---|---|---|---|---|
| 2026 | $3,185 | $200,325 | $12,672 | $187,653 |
| 2025 | $3,185 | $197,044 | $12,672 | $184,372 |
| 2024 | $2,765 | $193,758 | $12,288 | $181,470 |
| 2023 | $2,765 | $190,074 | $12,880 | $177,194 |
| 2022 | $2,370 | $140,215 | $9,384 | $130,831 |
| 2021 | $2,218 | $114,694 | $8,272 | $106,422 |
| 2020 | $2,043 | $105,629 | $8,272 | $97,357 |
| 2019 | $1,928 | $102,812 | $3,760 | $99,052 |
| 2018 | $1,775 | $87,172 | $3,760 | $83,412 |
| 2017 | $1,723 | $81,267 | $2,808 | $78,459 |
| 2016 | $223 | $10,032 | $0 | $0 |
| 2015 | $215 | $9,194 | $0 | $0 |
| 2014 | -- | $9,219 | $0 | $0 |
Source: Public Records
Map
Nearby Homes
- 638 Orange Ave
- 572 Magnolia Ave
- 575 Live Oak Ave
- 335 Maple St
- 557 Live Oak Ave
- 339 Maple St
- 241 S Franklin St
- 325 S Franklin St
- 809 Maley St
- 507 Wallace St
- 437 Lockhart St
- 828 Magnolia Ave
- 317 Reva St
- 00 Division St
- TBD Division St
- 0 Orange Ave
- 410 Arroyo Ln
- 538 Loomis Ave
- 241 Martin Luther King Blvd S
- 735 Martin Luther King Blvd S
Your Personal Tour Guide
Ask me questions while you tour the home.