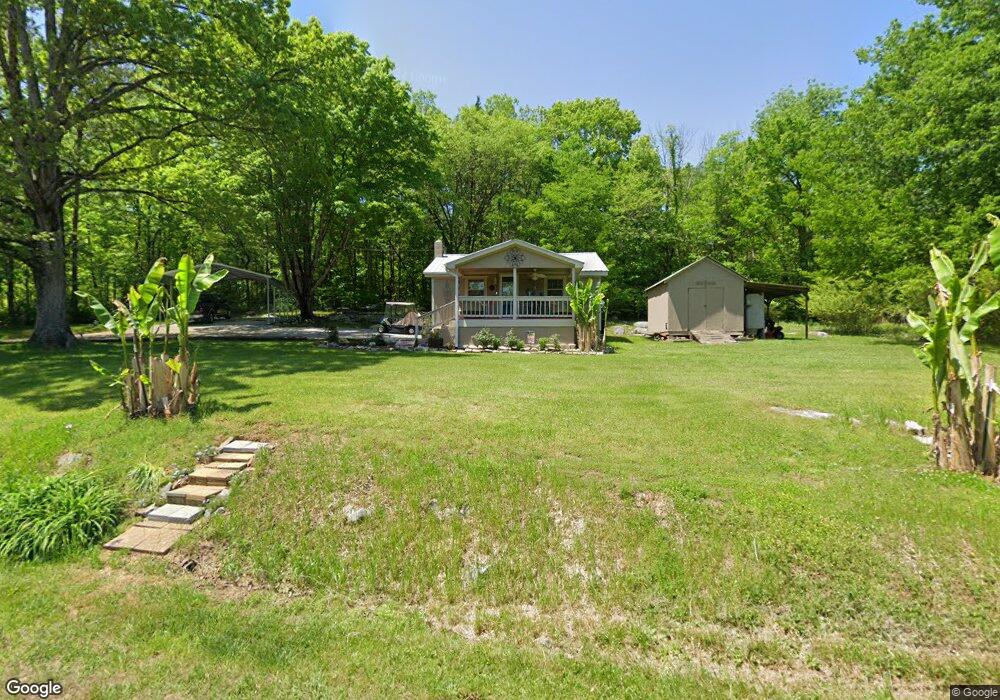
635 Dugan Loop Trenton, GA 30752
Estimated Value: $163,870 - $272,000
2
Beds
1
Bath
900
Sq Ft
$218/Sq Ft
Est. Value
About This Home
This home is located at 635 Dugan Loop, Trenton, GA 30752 and is currently estimated at $195,968, approximately $217 per square foot. 635 Dugan Loop is a home located in Dade County with nearby schools including Dade Middle School and Dade County High School.
Ownership History
Date
Name
Owned For
Owner Type
Purchase Details
Closed on
Aug 3, 2023
Sold by
Hoodenpyle David
Bought by
Schepisi Anthony and Schepisi Caren Dugan
Current Estimated Value
Home Financials for this Owner
Home Financials are based on the most recent Mortgage that was taken out on this home.
Original Mortgage
$147,789
Outstanding Balance
$48,392
Interest Rate
6.81%
Mortgage Type
New Conventional
Estimated Equity
$147,576
Purchase Details
Closed on
Apr 30, 2021
Sold by
Case Robert Alan
Bought by
Hoodenpyle David G and Hoodenpyle Lou Ann
Purchase Details
Closed on
Sep 30, 2008
Sold by
Forshee J P
Bought by
Case Robert Alan and Case Karen R
Home Financials for this Owner
Home Financials are based on the most recent Mortgage that was taken out on this home.
Original Mortgage
$11,000
Interest Rate
6.34%
Mortgage Type
New Conventional
Purchase Details
Closed on
Jun 13, 1991
Sold by
Clarence Wooden
Bought by
Forshee J P
Create a Home Valuation Report for This Property
The Home Valuation Report is an in-depth analysis detailing your home's value as well as a comparison with similar homes in the area
Home Values in the Area
Average Home Value in this Area
Purchase History
| Date | Buyer | Sale Price | Title Company |
|---|---|---|---|
| Schepisi Anthony | $160,000 | -- | |
| Hoodenpyle David G | $55,000 | -- | |
| Case Robert Alan | $65,000 | -- | |
| Forshee J P | $6,200 | -- |
Source: Public Records
Mortgage History
| Date | Status | Borrower | Loan Amount |
|---|---|---|---|
| Open | Schepisi Anthony | $147,789 | |
| Previous Owner | Case Robert Alan | $11,000 |
Source: Public Records
Tax History Compared to Growth
Tax History
| Year | Tax Paid | Tax Assessment Tax Assessment Total Assessment is a certain percentage of the fair market value that is determined by local assessors to be the total taxable value of land and additions on the property. | Land | Improvement |
|---|---|---|---|---|
| 2024 | $1,158 | $52,640 | $2,480 | $50,160 |
| 2023 | $923 | $41,220 | $1,760 | $39,460 |
| 2022 | $8 | $23,020 | $1,760 | $21,260 |
| 2021 | $238 | $11,300 | $1,760 | $9,540 |
| 2020 | $224 | $9,620 | $1,200 | $8,420 |
| 2019 | $193 | $8,180 | $1,200 | $6,980 |
| 2018 | $196 | $8,180 | $1,200 | $6,980 |
| 2017 | $196 | $8,180 | $1,200 | $6,980 |
| 2016 | $195 | $8,180 | $1,200 | $6,980 |
| 2015 | $210 | $8,980 | $2,000 | $6,980 |
| 2014 | -- | $13,560 | $2,000 | $11,560 |
| 2013 | -- | $12,600 | $2,000 | $10,600 |
Source: Public Records
Map
Nearby Homes
- 0 Slygo Rd Unit 10409260
- 0 Slygo Rd Unit 1385567
- 0 Slygo Rd Unit RTC2612526
- 0 Slygo Rd Unit 7479663
- Lot 05 Windstone Dr
- Lot 10 Windstone Dr
- Lot 13 Windstone Dr
- 316 Old Hales Gap Rd
- 0 Veterans Rd Unit 15134719
- 984 Murphy Hollow Rd
- 140 Patterson Dr
- 227 S Deer Run Rd
- 616 Stallings Rd
- 1255 New Home Rd
- 148 Carroll Rd
- 6180 Slygo Rd
- 37 Scratch Ankle Rd
- 71 Ballard Rd
- 41 Ballard Rd
- 27 Oak Shadow Dr
- 592 Dugan Loop
- 590 Dugan Loop
- 0000 Dugan Loop
- 1501 Dugan Loop
- 790 Dugan Loop
- 857 Dugan Loop
- 424 Dugan Loop
- 1010 Dugan Loop
- 1010 Dugan Loop
- 935 Dugan Loop
- 1050 Dugan Loop
- 390 Dugan Loop
- 1096 Dugan Loop
- 330 Dugan Loop
- 1061 Dugan Loop
- 296 Dugan Loop
- 1234 Dugan Loop
- 1121 Dugan Loop
- 123 Red Moore Rd
- 109 Red Moore Rd