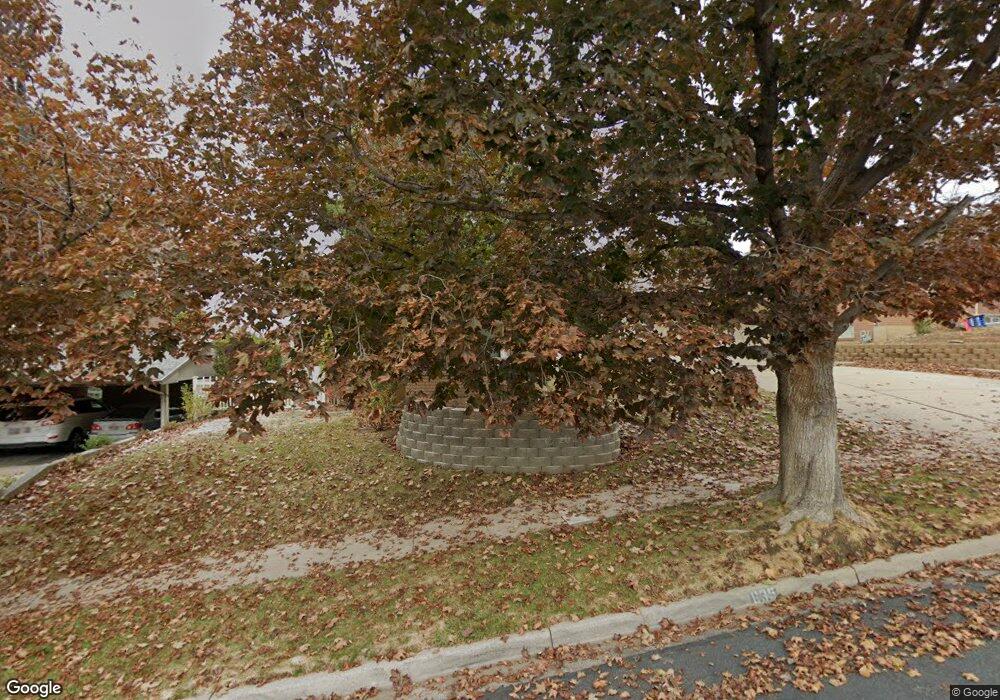
635 E 250 N Bountiful, UT 84010
Estimated Value: $531,000 - $577,000
5
Beds
3
Baths
2,410
Sq Ft
$230/Sq Ft
Est. Value
About This Home
This home is located at 635 E 250 N, Bountiful, UT 84010 and is currently estimated at $555,483, approximately $230 per square foot. 635 E 250 N is a home located in Davis County with nearby schools including Holbrook Elementary School, Bountiful Junior High School, and Bountiful High School.
Ownership History
Date
Name
Owned For
Owner Type
Purchase Details
Closed on
Dec 21, 2021
Sold by
Perry Ryan S and Perry Krista
Bought by
Combe Ryan and Combe Amy
Current Estimated Value
Home Financials for this Owner
Home Financials are based on the most recent Mortgage that was taken out on this home.
Original Mortgage
$482,300
Outstanding Balance
$442,812
Interest Rate
2.98%
Mortgage Type
New Conventional
Estimated Equity
$112,671
Purchase Details
Closed on
Aug 15, 2018
Sold by
Petersen Nathan and Petersen Christi K
Bought by
Perry Ryan S and Perry Krista
Home Financials for this Owner
Home Financials are based on the most recent Mortgage that was taken out on this home.
Original Mortgage
$344,350
Interest Rate
4.5%
Mortgage Type
New Conventional
Purchase Details
Closed on
Feb 10, 2005
Sold by
Busse Walter E and Busse Julia L
Bought by
Busse Walter E and Busse Julia L
Create a Home Valuation Report for This Property
The Home Valuation Report is an in-depth analysis detailing your home's value as well as a comparison with similar homes in the area
Purchase History
| Date | Buyer | Sale Price | Title Company |
|---|---|---|---|
| Combe Ryan | -- | Us Title Company Of Utah | |
| Perry Ryan S | -- | Aspen Title Insurance | |
| Busse Walter E | -- | -- |
Source: Public Records
Mortgage History
| Date | Status | Borrower | Loan Amount |
|---|---|---|---|
| Open | Combe Ryan | $482,300 | |
| Closed | Perry Ryan S | $344,350 |
Source: Public Records
Tax History
| Year | Tax Paid | Tax Assessment Tax Assessment Total Assessment is a certain percentage of the fair market value that is determined by local assessors to be the total taxable value of land and additions on the property. | Land | Improvement |
|---|---|---|---|---|
| 2025 | $3,083 | $282,700 | $118,517 | $164,183 |
| 2024 | $2,892 | $275,000 | $109,495 | $165,505 |
| 2023 | $2,861 | $494,000 | $195,631 | $298,369 |
| 2022 | $2,987 | $283,250 | $103,771 | $179,479 |
| 2021 | $2,416 | $348,000 | $153,989 | $194,011 |
| 2020 | $2,126 | $307,000 | $140,279 | $166,721 |
| 2019 | $2,121 | $299,000 | $144,713 | $154,287 |
| 2018 | $2,003 | $278,000 | $133,525 | $144,475 |
| 2016 | $1,656 | $124,025 | $39,741 | $84,284 |
| 2015 | $1,650 | $116,820 | $40,815 | $76,005 |
| 2014 | $1,626 | $118,439 | $40,815 | $77,624 |
| 2013 | -- | $99,569 | $50,459 | $49,110 |
Source: Public Records
Map
Nearby Homes
- 683 E 100 N
- 129 N 800 E
- 6 N 800 E
- 513 N 400 E Unit 14B
- 453 N 400 E Unit 7-D
- 698 E 200 S
- 456 E 500 S
- 255 E 400 S
- 49 E 200 N Unit 4
- 41 E 200 N Unit 6
- 1138 Briggs Dr
- 520 S Orchard Dr Unit 17
- 55 E 200 N Unit 2
- 51 E 200 N Unit 3
- 17 E 400 N Unit 19B
- 256 N Main St
- 254 N Main St
- 908 Northern Hills Dr Unit 3
- 252 N Main St
- 978 N 170 E
Your Personal Tour Guide
Ask me questions while you tour the home.