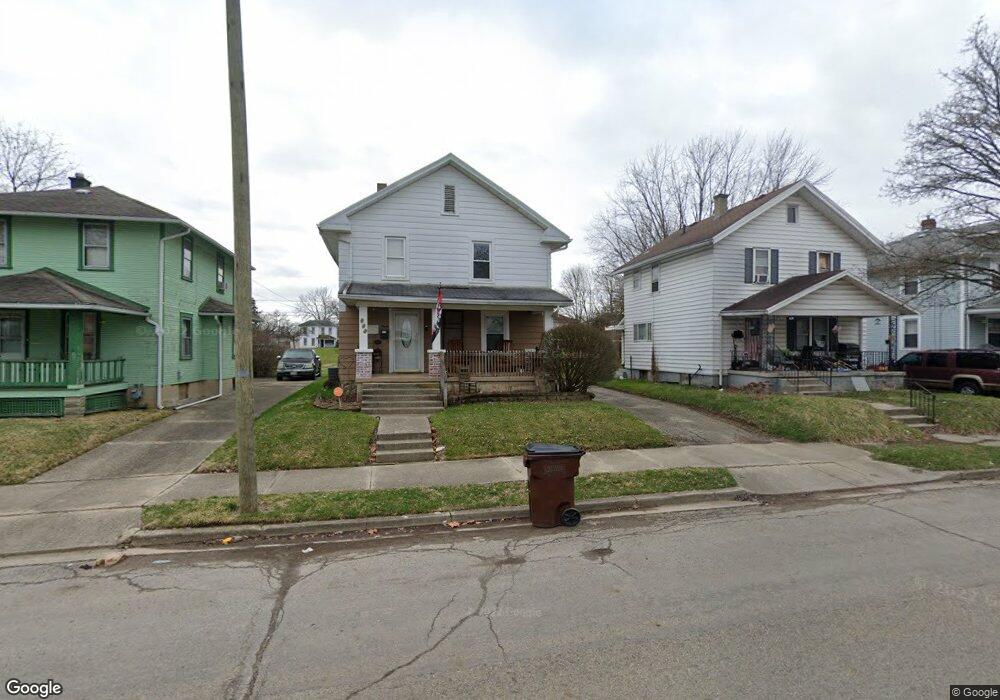
635 E Euclid Ave Springfield, OH 45505
Estimated Value: $84,000 - $118,000
3
Beds
1
Bath
1,152
Sq Ft
$87/Sq Ft
Est. Value
About This Home
This home is located at 635 E Euclid Ave, Springfield, OH 45505 and is currently estimated at $99,867, approximately $86 per square foot. 635 E Euclid Ave is a home located in Clark County with nearby schools including Kenwood Elementary School, Hayward Middle School, and Springfield High School.
Ownership History
Date
Name
Owned For
Owner Type
Purchase Details
Closed on
Apr 19, 2017
Sold by
Springer Joseph A
Bought by
Fisher Kristi L
Current Estimated Value
Home Financials for this Owner
Home Financials are based on the most recent Mortgage that was taken out on this home.
Original Mortgage
$29,100
Outstanding Balance
$23,995
Interest Rate
4.14%
Mortgage Type
New Conventional
Estimated Equity
$75,872
Purchase Details
Closed on
Apr 10, 2015
Sold by
Lisch Amy M and Springer Amy M
Bought by
Springer Joseph A
Purchase Details
Closed on
Jun 29, 2001
Sold by
Hoffman Jacquelyn J
Bought by
Springer Joseph A and Lisch Amy M
Home Financials for this Owner
Home Financials are based on the most recent Mortgage that was taken out on this home.
Original Mortgage
$50,212
Interest Rate
7.18%
Mortgage Type
FHA
Create a Home Valuation Report for This Property
The Home Valuation Report is an in-depth analysis detailing your home's value as well as a comparison with similar homes in the area
Home Values in the Area
Average Home Value in this Area
Purchase History
| Date | Buyer | Sale Price | Title Company |
|---|---|---|---|
| Fisher Kristi L | $30,000 | None Available | |
| Springer Joseph A | -- | Attorney | |
| Springer Joseph A | $51,000 | -- |
Source: Public Records
Mortgage History
| Date | Status | Borrower | Loan Amount |
|---|---|---|---|
| Open | Fisher Kristi L | $29,100 | |
| Previous Owner | Springer Joseph A | $50,212 |
Source: Public Records
Tax History
| Year | Tax Paid | Tax Assessment Tax Assessment Total Assessment is a certain percentage of the fair market value that is determined by local assessors to be the total taxable value of land and additions on the property. | Land | Improvement |
|---|---|---|---|---|
| 2025 | $742 | $19,670 | $2,830 | $16,840 |
| 2024 | $723 | $15,000 | $2,590 | $12,410 |
| 2023 | $723 | $15,000 | $2,590 | $12,410 |
| 2022 | $740 | $15,000 | $2,590 | $12,410 |
| 2021 | $650 | $12,150 | $2,020 | $10,130 |
| 2020 | $651 | $12,150 | $2,020 | $10,130 |
| 2019 | $653 | $12,150 | $2,020 | $10,130 |
| 2018 | $658 | $11,770 | $1,840 | $9,930 |
| 2017 | $658 | $11,771 | $1,838 | $9,933 |
| 2016 | $659 | $11,771 | $1,838 | $9,933 |
| 2015 | $1,041 | $11,771 | $1,838 | $9,933 |
| 2014 | $669 | $11,771 | $1,838 | $9,933 |
| 2013 | $662 | $11,771 | $1,838 | $9,933 |
Source: Public Records
Map
Nearby Homes
- 1008 Tibbetts Ave
- 652 E Southern Ave
- 441 E Euclid Ave
- 550 E Rose St
- 705 York St
- 900 E Rose St
- 718 Summer St
- 625 Tibbetts Ave
- 230 Rice St
- 1111 Lafayette Ave
- 205 E Grand Ave
- 1502 Linden Ave
- 453 E Pleasant St
- 908 Pine St
- 1417 Clifton Ave Unit 1419
- 1724 Clay St
- 907-913 S Limestone St
- 418 Linden Ave
- 1440 Selma Rd
- 0 W Perrin Ave Unit 1043508
- 639 E Euclid Ave
- 631 E Euclid Ave
- 643 E Euclid Ave
- 629 E Euclid Ave
- 625 E Euclid Ave
- 623 E Euclid Ave
- 630 E Grand Ave
- 628 E Grand Ave
- 1015 East St
- 615 E Euclid Ave
- 640 E Euclid Ave
- 1117 East St
- 638 E Euclid Ave
- 644 E Euclid Ave
- 634 E Euclid Ave
- 624 E Grand Ave
- 640 E Grand Ave
- 1119 East St
- 630 E Euclid Ave
- 927 East St
Your Personal Tour Guide
Ask me questions while you tour the home.