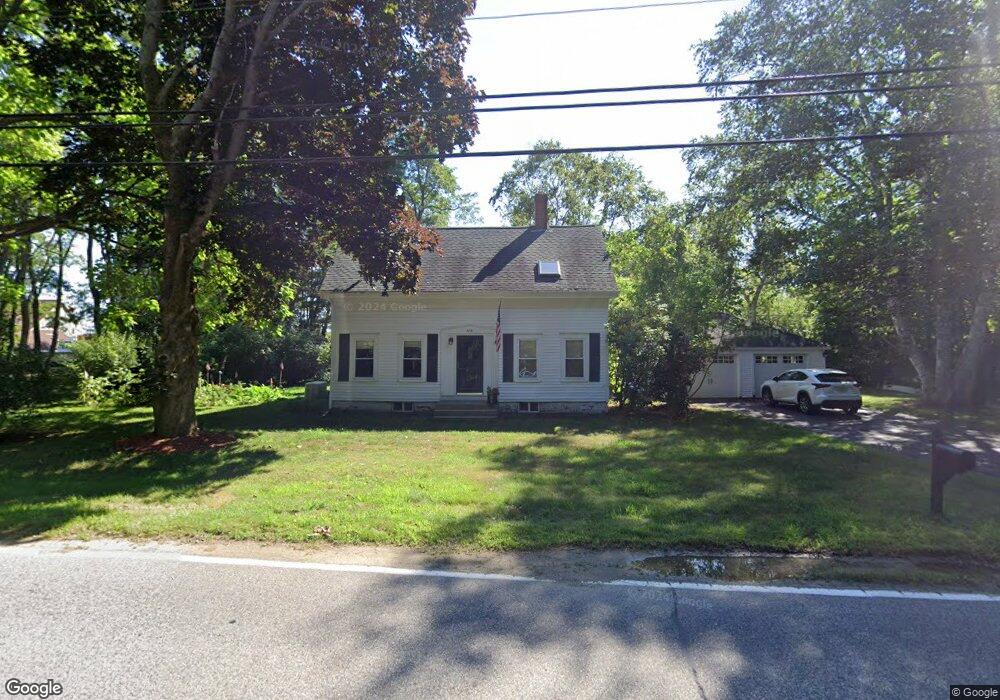
635 Ferry Rd Saco, ME 04072
Ferry Beach NeighborhoodEstimated Value: $482,323 - $759,000
3
Beds
2
Baths
1,320
Sq Ft
$471/Sq Ft
Est. Value
About This Home
This home is located at 635 Ferry Rd, Saco, ME 04072 and is currently estimated at $621,081, approximately $470 per square foot. 635 Ferry Rd is a home located in York County with nearby schools including C K Burns School, Saco Middle School, and Florence Lombard Christian School.
Ownership History
Date
Name
Owned For
Owner Type
Purchase Details
Closed on
Dec 1, 2009
Sold by
Pelletier Arthur J and Pelletier Diane L
Bought by
Miele Joyce D and Monier Alan J
Current Estimated Value
Home Financials for this Owner
Home Financials are based on the most recent Mortgage that was taken out on this home.
Original Mortgage
$188,000
Interest Rate
4.92%
Mortgage Type
Unknown
Create a Home Valuation Report for This Property
The Home Valuation Report is an in-depth analysis detailing your home's value as well as a comparison with similar homes in the area
Home Values in the Area
Average Home Value in this Area
Purchase History
| Date | Buyer | Sale Price | Title Company |
|---|---|---|---|
| Miele Joyce D | -- | -- |
Source: Public Records
Mortgage History
| Date | Status | Borrower | Loan Amount |
|---|---|---|---|
| Closed | Miele Joyce D | $188,000 |
Source: Public Records
Tax History
| Year | Tax Paid | Tax Assessment Tax Assessment Total Assessment is a certain percentage of the fair market value that is determined by local assessors to be the total taxable value of land and additions on the property. | Land | Improvement |
|---|---|---|---|---|
| 2024 | $4,950 | $352,300 | $211,100 | $141,200 |
| 2023 | $5,196 | $352,300 | $211,100 | $141,200 |
| 2022 | $4,857 | $265,000 | $161,200 | $103,800 |
| 2021 | $4,669 | $247,300 | $147,300 | $100,000 |
| 2020 | $4,414 | $224,400 | $131,900 | $92,500 |
| 2019 | $4,349 | $224,400 | $131,900 | $92,500 |
| 2018 | $4,244 | $219,000 | $126,500 | $92,500 |
| 2017 | $4,021 | $207,500 | $115,700 | $91,800 |
| 2016 | $4,455 | $229,400 | $111,700 | $117,700 |
| 2015 | $4,386 | $228,200 | $111,700 | $116,500 |
| 2014 | $4,249 | $228,200 | $111,700 | $116,500 |
| 2013 | $4,240 | $228,200 | $111,700 | $116,500 |
Source: Public Records
Map
Nearby Homes
- 46 Ferry Ln
- 1 Main Ave
- 10 Lower Beach Rd
- 9 Riverside Ave
- 650 Pool St
- 625 Pool St
- 1 Willow Ridge
- 3 Walker Dr Unit 101
- 4 Walker Dr Unit 101
- 3 Walker Dr Unit 101
- TBD 530 Ferry Rd
- 280 Seaside Ave
- 125 Hills Beach Rd
- 30 Vines Rd
- 295 Ferry Rd
- 8 Days Landing
- 74 Guinea Rd
- 88-90 Old Pool Rd
- 378 Pool St
- 353 Pool St
Your Personal Tour Guide
Ask me questions while you tour the home.