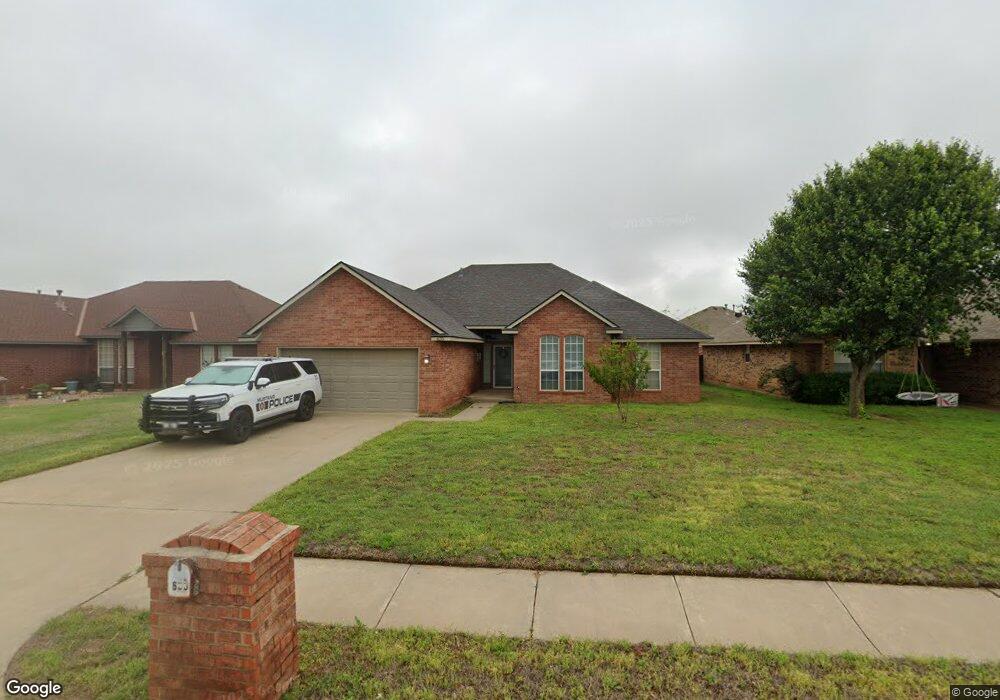
635 Hunters Way Mustang, OK 73064
Estimated Value: $230,850 - $261,000
3
Beds
2
Baths
1,626
Sq Ft
$150/Sq Ft
Est. Value
About This Home
This home is located at 635 Hunters Way, Mustang, OK 73064 and is currently estimated at $244,213, approximately $150 per square foot. 635 Hunters Way is a home located in Canadian County with nearby schools including Mustang Lakehoma Elementary School, Mustang Horizon Intermediate School, and Mustang Middle School.
Ownership History
Date
Name
Owned For
Owner Type
Purchase Details
Closed on
Dec 4, 2006
Sold by
Demuth Randy G and Demuth Rebecca S
Bought by
Burnett Roger Paul and Burnett Andrea
Current Estimated Value
Home Financials for this Owner
Home Financials are based on the most recent Mortgage that was taken out on this home.
Original Mortgage
$132,284
Outstanding Balance
$79,527
Interest Rate
6.41%
Mortgage Type
VA
Estimated Equity
$164,686
Purchase Details
Closed on
Jun 7, 2004
Sold by
Nelson Bradley D
Home Financials for this Owner
Home Financials are based on the most recent Mortgage that was taken out on this home.
Original Mortgage
$107,100
Interest Rate
5.97%
Purchase Details
Closed on
May 1, 2002
Sold by
Oak Grove Homes Inc
Purchase Details
Closed on
Feb 26, 1999
Sold by
Manwarren Howard A and Manwarren Ramona
Purchase Details
Closed on
Jun 12, 1997
Sold by
Hunters Crossing Devel Co
Create a Home Valuation Report for This Property
The Home Valuation Report is an in-depth analysis detailing your home's value as well as a comparison with similar homes in the area
Home Values in the Area
Average Home Value in this Area
Purchase History
| Date | Buyer | Sale Price | Title Company |
|---|---|---|---|
| Burnett Roger Paul | $97,125 | None Available | |
| -- | $119,000 | -- | |
| -- | $108,000 | -- | |
| -- | $30,000 | -- | |
| -- | $326,000 | -- |
Source: Public Records
Mortgage History
| Date | Status | Borrower | Loan Amount |
|---|---|---|---|
| Open | Burnett Roger Paul | $132,284 | |
| Previous Owner | -- | $107,100 |
Source: Public Records
Tax History Compared to Growth
Tax History
| Year | Tax Paid | Tax Assessment Tax Assessment Total Assessment is a certain percentage of the fair market value that is determined by local assessors to be the total taxable value of land and additions on the property. | Land | Improvement |
|---|---|---|---|---|
| 2024 | $1,685 | $18,427 | $2,220 | $16,207 |
| 2023 | $1,685 | $17,891 | $2,220 | $15,671 |
| 2022 | $1,653 | $17,370 | $2,220 | $15,150 |
| 2021 | $1,608 | $16,864 | $2,220 | $14,644 |
| 2020 | $1,568 | $16,373 | $2,220 | $14,153 |
| 2019 | $1,520 | $15,896 | $2,220 | $13,676 |
| 2018 | $1,504 | $15,433 | $2,220 | $13,213 |
| 2017 | $1,441 | $14,983 | $2,220 | $12,763 |
| 2016 | $1,586 | $16,772 | $2,220 | $14,552 |
| 2015 | $1,498 | $15,884 | $2,220 | $13,664 |
| 2014 | $1,498 | $15,422 | $2,220 | $13,202 |
Source: Public Records
Map
Nearby Homes
- 601 N Chisholm Trail Way
- 508 N Caddell Way
- 628 W Alamo Court Way
- 608 N Remington Way
- 602 W Shadow Ridge Way
- 531 W Shadow Ridge Way
- 1035 W Windsor Way
- 413 W Pines Way
- 237 W Pines Way
- 1005 W Ridgehaven Way
- 844 W Forest Dr
- 900 W Nandina Way
- 850 W Forest Dr
- 613 W Greenwood Ct
- 635 W Hillcrest Dr
- 606 N Pine Branch Way
- 3629 Blue Ave
- 3633 Blue Ave
- 3637 Pete St
- 3636 Blue Ave
- 631 Hunters Way
- 701 Hunters Way
- 413 N Cherokee Way
- 705 Hunters Way
- 627 Hunters Way
- 412 N Cherokee Way
- 417 N Cherokee Way
- 700 Hunters Way
- 700 Hunters Way
- 636 Hunters Way
- 709 Hunters Way
- 632 Hunters Way
- 704 Hunters Way
- 414 N Chisholm Trail Way
- 416 N Cherokee Way
- 418 N Chisholm Trail Way
- 404 Arrowhead Way
- 708 Hunters Way
- 630 W Pine Rose Court Way
- 400 Arrowhead Way