635 Huntington Rd Athens, GA 30606
Estimated Value: $169,000 - $197,000
--
Bed
2
Baths
1,056
Sq Ft
$172/Sq Ft
Est. Value
About This Home
This home is located at 635 Huntington Rd, Athens, GA 30606 and is currently estimated at $182,115, approximately $172 per square foot. 635 Huntington Rd is a home located in Clarke County with nearby schools including Cleveland Road Elementary School, Burney-Harris-Lyons Middle School, and Clarke Central High School.
Ownership History
Date
Name
Owned For
Owner Type
Purchase Details
Closed on
Mar 29, 2013
Sold by
Emily J Todd
Bought by
Vitale Christopher and Vitale Elizabeth
Current Estimated Value
Purchase Details
Closed on
Feb 7, 2012
Sold by
Bank Of America
Bought by
Emily Todd
Purchase Details
Closed on
Aug 30, 2006
Sold by
Not Provided
Bought by
Faulkner E Janet and Faulkner James Nathan
Purchase Details
Closed on
Jul 1, 2004
Sold by
Elliott Derek Cory
Bought by
Davis Wayne Patrick
Purchase Details
Closed on
Apr 29, 1996
Sold by
Cook Collins Gene
Bought by
Elliott Derek Cory
Purchase Details
Closed on
Jun 16, 1995
Sold by
Cook Collins Gene and Amy Marie R Cook
Bought by
Cook Collins Gene
Purchase Details
Closed on
Apr 12, 1993
Sold by
Pritchard J Lee
Bought by
Cook Collins Gene and Amy Marie R
Purchase Details
Closed on
Aug 11, 1989
Sold by
Lawrence Shea & Mc Rae Inc
Bought by
Pritchard J Lee
Create a Home Valuation Report for This Property
The Home Valuation Report is an in-depth analysis detailing your home's value as well as a comparison with similar homes in the area
Home Values in the Area
Average Home Value in this Area
Purchase History
| Date | Buyer | Sale Price | Title Company |
|---|---|---|---|
| Vitale Christopher | $62,000 | -- | |
| Emily Todd | $37,483 | -- | |
| Faulkner E Janet | -- | -- | |
| Faulkner E Janet | $99,900 | -- | |
| Davis Wayne Patrick | $93,000 | -- | |
| Elliott Derek Cory | $58,500 | -- | |
| Cook Collins Gene | -- | -- | |
| Cook Collins Gene | $57,500 | -- | |
| Pritchard J Lee | $58,000 | -- |
Source: Public Records
Tax History Compared to Growth
Tax History
| Year | Tax Paid | Tax Assessment Tax Assessment Total Assessment is a certain percentage of the fair market value that is determined by local assessors to be the total taxable value of land and additions on the property. | Land | Improvement |
|---|---|---|---|---|
| 2025 | $2,448 | $78,843 | $8,000 | $70,843 |
| 2024 | $2,448 | $77,944 | $8,000 | $69,944 |
| 2023 | $2,436 | $64,119 | $8,000 | $56,119 |
| 2022 | $1,720 | $53,928 | $8,000 | $45,928 |
| 2021 | $1,266 | $37,567 | $8,000 | $29,567 |
| 2020 | $1,238 | $36,734 | $8,000 | $28,734 |
| 2019 | $1,118 | $32,929 | $8,000 | $24,929 |
| 2018 | $990 | $29,161 | $8,000 | $21,161 |
| 2017 | $0 | $28,998 | $8,000 | $20,998 |
| 2016 | $951 | $28,013 | $8,000 | $20,013 |
| 2015 | $897 | $26,390 | $8,000 | $18,390 |
| 2014 | $815 | $23,923 | $8,000 | $15,923 |
Source: Public Records
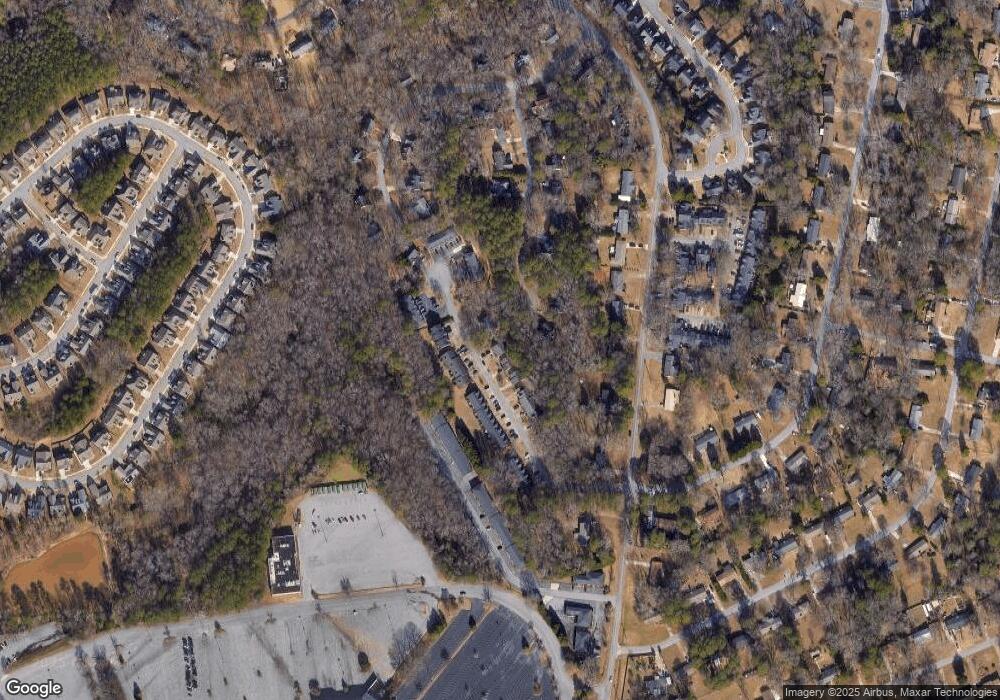
Map
Nearby Homes
- 637 Huntington Rd Unit B1
- 470 Huntington Rd Unit 5
- 532 Huntington Rd Unit 7
- 141 Huntington Shoals Dr
- 241 Meeler Cir
- 212 Huntington Shoals Dr
- 240 W Huntington Rd
- 256 Cherokee Ridge
- 170 Huntington Ct
- 190 W Huntington Rd
- 211 Littleton Way
- 150 Callaway Dr
- 682 Chesterfield Rd
- 240 Cleveland Rd Unit 105
- 450 River Bottom Rd
- 178 Ben Burton Cir
- 165 Mill Center Blvd Unit 208
- 165 Mill Center Blvd Unit 104
- 635 Huntington Rd Unit 803
- 635 Huntington Rd Unit 302
- 635 Huntington Rd Unit 101
- 635 Huntington Rd Unit 106
- 635 Huntington Rd Unit 210
- 635 Huntington Rd Unit 301
- 635 Huntington Rd Unit 105
- 635 Huntington Rd Unit 208
- 635 Huntington Rd Unit 304
- 635 Huntington Rd Unit 801
- 635 Huntington Rd Unit 702
- 635 Huntington Rd
- 635 Huntington Rd
- 635 Huntington Rd
- 635 Huntington Rd
- 635 Huntington Rd
- 635 Huntington Rd
- 635 Huntington Rd
- 635 Huntington Rd
- 635 Huntington Rd