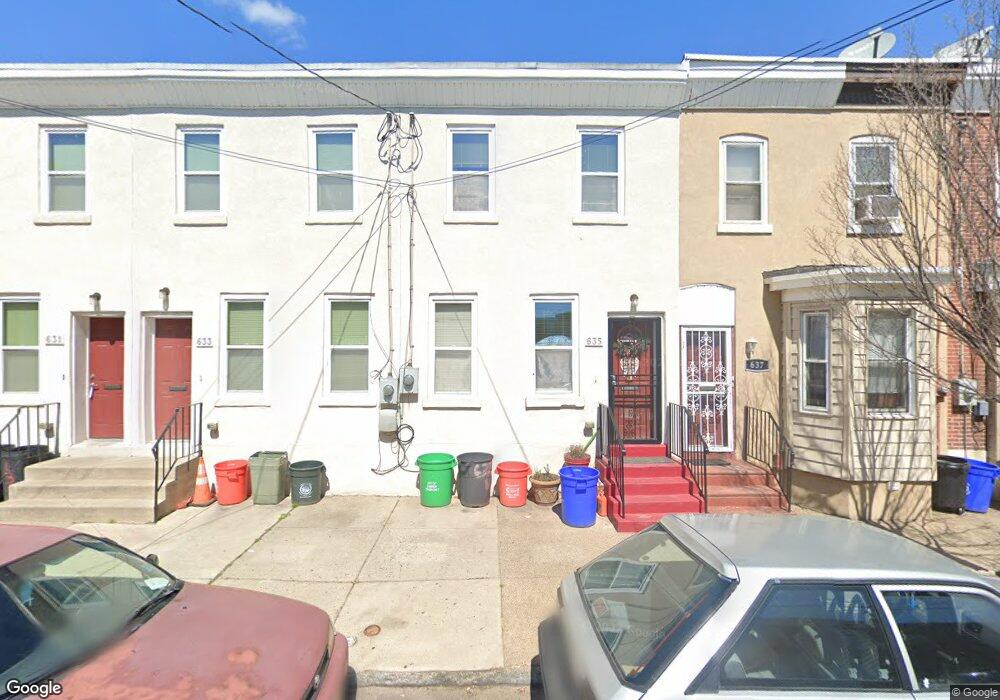
635 Line St Camden, NJ 08103
Lanning Square NeighborhoodEstimated Value: $112,526 - $168,000
Studio
--
Bath
784
Sq Ft
$181/Sq Ft
Est. Value
About This Home
This home is located at 635 Line St, Camden, NJ 08103 and is currently estimated at $141,882, approximately $180 per square foot. 635 Line St is a home located in Camden County with nearby schools including Camden High School, Hope Community Charter School, and Leap Academy University Charter School.
Ownership History
Date
Name
Owned For
Owner Type
Purchase Details
Closed on
Jun 1, 2014
Sold by
Broadway Townhouses Lp
Bought by
Broadway Associates 2010 Llc
Current Estimated Value
Create a Home Valuation Report for This Property
The Home Valuation Report is an in-depth analysis detailing your home's value as well as a comparison with similar homes in the area
Home Values in the Area
Average Home Value in this Area
Purchase History
| Date | Buyer | Sale Price | Title Company |
|---|---|---|---|
| Broadway Associates 2010 Llc | $17,321,202 | First American Title Ins Co |
Source: Public Records
Tax History
| Year | Tax Paid | Tax Assessment Tax Assessment Total Assessment is a certain percentage of the fair market value that is determined by local assessors to be the total taxable value of land and additions on the property. | Land | Improvement |
|---|---|---|---|---|
| 2025 | $2,223 | $60,300 | $6,100 | $54,200 |
| 2024 | $2,065 | $60,300 | $6,100 | $54,200 |
| 2023 | $2,065 | $60,300 | $6,100 | $54,200 |
| 2022 | $2,027 | $60,300 | $6,100 | $54,200 |
| 2021 | $2,019 | $60,300 | $6,100 | $54,200 |
| 2020 | $1,918 | $60,300 | $6,100 | $54,200 |
| 2019 | $1,346 | $60,300 | $6,100 | $54,200 |
| 2018 | $1,339 | $77,700 | $6,100 | $71,600 |
| 2017 | $1,306 | $77,700 | $6,100 | $71,600 |
| 2016 | $1,265 | $77,700 | $6,100 | $71,600 |
| 2015 | $1,217 | $77,700 | $6,100 | $71,600 |
| 2014 | $1,188 | $44,200 | $6,100 | $38,100 |
Source: Public Records
Map
Nearby Homes
Your Personal Tour Guide
Ask me questions while you tour the home.