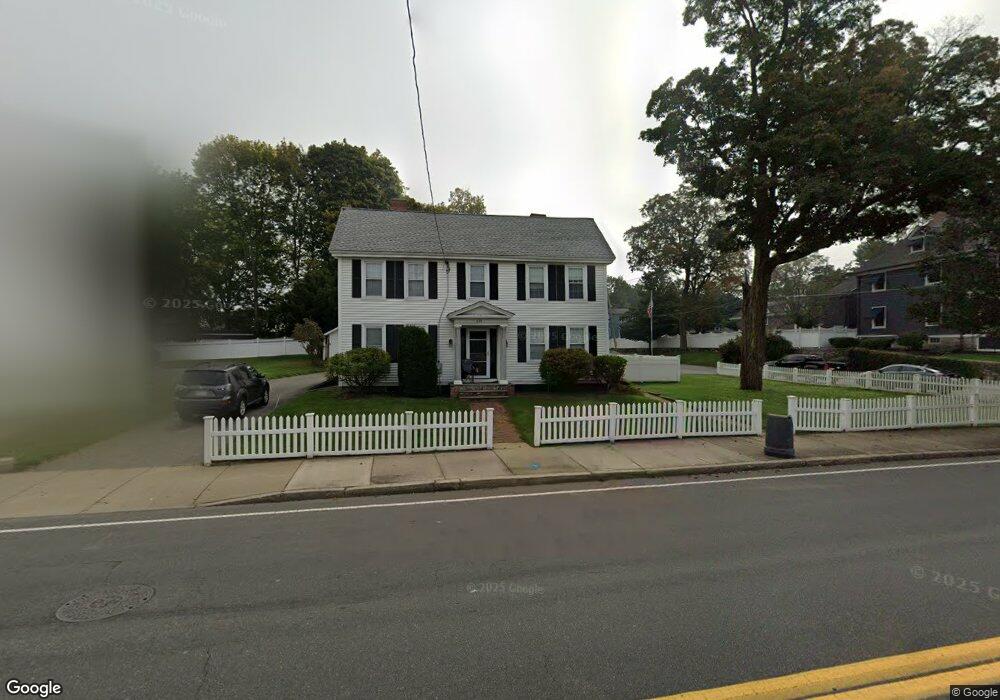
635 Main St Woburn, MA 01801
Downtown Woburn NeighborhoodEstimated Value: $730,327 - $804,000
3
Beds
2
Baths
2,046
Sq Ft
$381/Sq Ft
Est. Value
About This Home
This home is located at 635 Main St, Woburn, MA 01801 and is currently estimated at $779,582, approximately $381 per square foot. 635 Main St is a home located in Middlesex County with nearby schools including Wyman Elementary School, John F. Kennedy Middle School, and Woburn High School.
Ownership History
Date
Name
Owned For
Owner Type
Purchase Details
Closed on
Aug 23, 2012
Sold by
Lennon Michael S and Lennon Ellen M
Bought by
James Harrison Nt and Lennon
Current Estimated Value
Home Financials for this Owner
Home Financials are based on the most recent Mortgage that was taken out on this home.
Original Mortgage
$280,000
Outstanding Balance
$193,423
Interest Rate
3.61%
Mortgage Type
New Conventional
Estimated Equity
$586,159
Purchase Details
Closed on
Apr 5, 2011
Sold by
Murray John M and Murray Marcia F
Bought by
Lennon Michael S and Lennon Ellen M
Home Financials for this Owner
Home Financials are based on the most recent Mortgage that was taken out on this home.
Original Mortgage
$248,000
Interest Rate
5.04%
Mortgage Type
Purchase Money Mortgage
Create a Home Valuation Report for This Property
The Home Valuation Report is an in-depth analysis detailing your home's value as well as a comparison with similar homes in the area
Home Values in the Area
Average Home Value in this Area
Purchase History
| Date | Buyer | Sale Price | Title Company |
|---|---|---|---|
| James Harrison Nt | $34,014 | -- | |
| James Harrison Nt | $34,014 | -- | |
| Lennon Michael S | $310,000 | -- | |
| Lennon Michael S | $310,000 | -- |
Source: Public Records
Mortgage History
| Date | Status | Borrower | Loan Amount |
|---|---|---|---|
| Open | James Harrison Nt | $280,000 | |
| Closed | Lennon Michael S | $280,000 | |
| Previous Owner | Lennon Michael S | $248,000 |
Source: Public Records
Tax History Compared to Growth
Tax History
| Year | Tax Paid | Tax Assessment Tax Assessment Total Assessment is a certain percentage of the fair market value that is determined by local assessors to be the total taxable value of land and additions on the property. | Land | Improvement |
|---|---|---|---|---|
| 2025 | $5,240 | $613,600 | $283,000 | $330,600 |
| 2024 | $4,663 | $578,500 | $269,600 | $308,900 |
| 2023 | $4,707 | $541,000 | $245,100 | $295,900 |
| 2022 | $4,538 | $485,900 | $213,100 | $272,800 |
| 2021 | $4,169 | $446,800 | $203,000 | $243,800 |
| 2020 | $4,151 | $445,400 | $203,000 | $242,400 |
| 2019 | $4,088 | $430,300 | $193,300 | $237,000 |
| 2018 | $3,851 | $389,400 | $177,300 | $212,100 |
| 2017 | $3,657 | $367,900 | $168,900 | $199,000 |
| 2016 | $3,497 | $348,000 | $157,800 | $190,200 |
| 2015 | $3,375 | $331,900 | $147,500 | $184,400 |
| 2014 | $3,250 | $311,300 | $147,500 | $163,800 |
Source: Public Records
Map
Nearby Homes
- 8 Clinton St
- 462 Place Ln
- 166 Place Ln Unit 166
- 168 Place Ln
- 602 Main St Unit 1
- 18 Hamilton Rd
- 14 Church Ave
- 14 Church Ave Unit 2
- 37 1/2 Chestnut St
- 18 Church St Unit 2
- 0 Fryeburg Rd
- 38 Middle St
- 26 Flagg St
- 21 Franklin St
- 17 Wright St
- 11 Hovey St
- 52 Middle St
- 9 Wade Ave
- 477 Main St
- 74 Beach St Unit 6-12
- 637 Main St
- 4 Blake St
- 1 Place Ln Unit G1
- 636 Main St
- 636 Main St Unit B
- 3 Place Ln Unit G3
- 9 Place Ln Unit G9
- 11 Place Ln Unit G11
- 13 Place Ln Unit G13
- 15 Place Ln Unit G15
- 629 Main St
- 17 Place Ln Unit G17
- 19 Place Ln Unit G19
- 639 Main St
- 6 Blake St
- 638 Main St
- 6 Place Ln Unit G6
- 8 Place Ln Unit G8
- 10 Place Ln Unit G10
- 12 Place Ln Unit G12