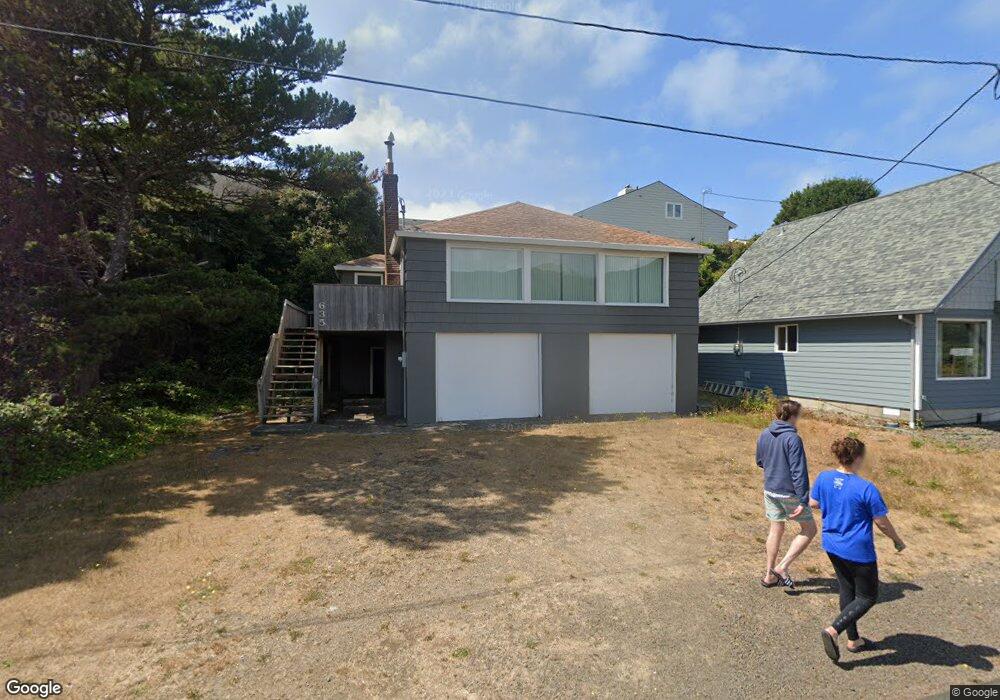
635 N Miller St Rockaway Beach, OR 97136
Estimated Value: $366,000 - $668,000
3
Beds
1
Bath
948
Sq Ft
$489/Sq Ft
Est. Value
About This Home
This home is located at 635 N Miller St, Rockaway Beach, OR 97136 and is currently estimated at $463,355, approximately $488 per square foot. 635 N Miller St is a home located in Tillamook County with nearby schools including Garibaldi Elementary School, Nehalem Elementary School, and Neah-Kah-Nie Middle School.
Ownership History
Date
Name
Owned For
Owner Type
Purchase Details
Closed on
Jun 6, 2023
Sold by
Johnson Paula
Bought by
Johnson Survivor & #39 & S Trust
Current Estimated Value
Purchase Details
Closed on
Apr 4, 2023
Sold by
Johnson Steven C
Bought by
Johnson Paula
Purchase Details
Closed on
Dec 20, 2019
Sold by
Johnson John and Johnson John W
Bought by
Johnson John W and Johnson Karen P
Purchase Details
Closed on
Aug 24, 2018
Sold by
Morgan Trenton P and Estate Of Nanci Leigh Johnson
Bought by
Morgan Trenton P and Nanci Leigh Johnson Family Tru
Purchase Details
Closed on
Aug 30, 2016
Sold by
Johnson Steven
Bought by
Johnson John and Johnson Steven
Purchase Details
Closed on
Sep 20, 2005
Sold by
Johnson Mary Kathryn
Bought by
Johnson Steven
Create a Home Valuation Report for This Property
The Home Valuation Report is an in-depth analysis detailing your home's value as well as a comparison with similar homes in the area
Home Values in the Area
Average Home Value in this Area
Purchase History
| Date | Buyer | Sale Price | Title Company |
|---|---|---|---|
| Johnson Survivor & #39 & S Trust | -- | None Listed On Document | |
| Johnson Paula | -- | None Listed On Document | |
| Johnson John W | -- | None Available | |
| Morgan Trenton P | -- | None Available | |
| Johnson John | -- | None Available | |
| Johnson Steven | -- | None Available | |
| Paxson Patricia | -- | None Available | |
| Johnson Josh | -- | None Available | |
| Johnson John | -- | None Available | |
| Johnson Nanci | -- | None Available |
Source: Public Records
Tax History Compared to Growth
Tax History
| Year | Tax Paid | Tax Assessment Tax Assessment Total Assessment is a certain percentage of the fair market value that is determined by local assessors to be the total taxable value of land and additions on the property. | Land | Improvement |
|---|---|---|---|---|
| 2024 | $1,589 | $163,840 | $86,080 | $77,760 |
| 2023 | $1,582 | $159,070 | $83,570 | $75,500 |
| 2022 | $1,533 | $154,440 | $81,140 | $73,300 |
| 2021 | $1,486 | $149,950 | $78,780 | $71,170 |
| 2020 | $1,444 | $145,590 | $76,490 | $69,100 |
| 2019 | $1,404 | $141,350 | $74,260 | $67,090 |
| 2018 | $1,368 | $137,240 | $72,100 | $65,140 |
| 2017 | $1,330 | $133,250 | $70,000 | $63,250 |
| 2016 | $1,292 | $129,370 | $67,960 | $61,410 |
| 2015 | $1,271 | $125,610 | $65,990 | $59,620 |
| 2014 | $1,253 | $121,960 | $64,080 | $57,880 |
| 2013 | -- | $118,410 | $62,220 | $56,190 |
Source: Public Records
Map
Nearby Homes
- 602 N Pacific St
- 0 Hwy 101(blk 18 Lots 18-31) St Unit Blk 18 Lots 32-35
- 711 N 6th Ave
- 0 Coral St (Blk 15 Lots 14-34) St Unit Blk 18 Lots 15-17
- 300 N Pacific St
- 300 N Pacific St Unit 37
- 300 N Pacific St Unit 54
- 300 N Pacific St Unit 43
- 317 N Beacon St
- 0 N Dolphin St Unit 663210409
- 115 N Miller St Unit 103
- 115 N Miller St Unit 303
- 250 N Harbor St
- 111 S Dolphin St
- 126 N Harbor St
- 0 N Marine St
- 0 Marine Dr Unit 472180158
- 1321 N Pacific Ln
- 0 N Ocean St Unit 472731104
- 0 N Ocean St Unit 478484794
- 639 N Miller St
- 680 N Pacific St
- 670 N Pacific St
- 680&682 N Pacific
- 641 N Miller St
- 660 N Pacific St
- 629 N Miller St
- 686 N Pacific St
- 690 N Pacific St
- 626 N Miller St
- 646 N Pacific St
- 670 N Highway 101
- 665 N Pacific St
- 691 N Pacific St
- 653 N Pacific St
- 702 N Pacific St
- 0 N Pacific St Unit TC-216
- 0 N Pacific St Unit 11421750
- 0 N Pacific St
- 0 N Hwy 101 Unit TC-5456