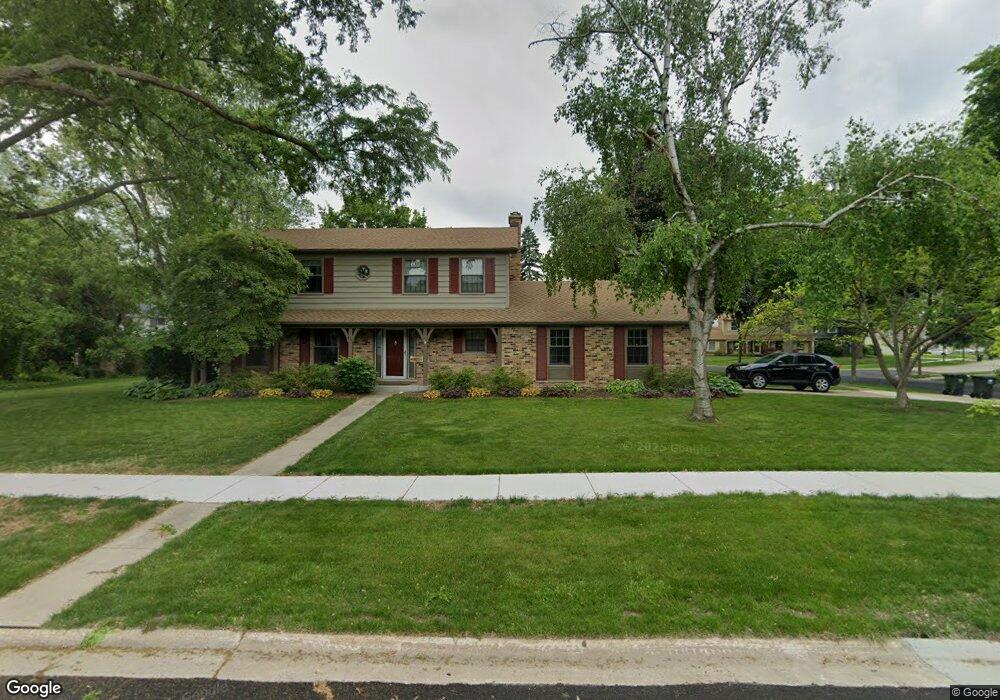
635 N Salem Ct Palatine, IL 60074
Willow Wood NeighborhoodEstimated Value: $502,000 - $595,000
4
Beds
3
Baths
2,128
Sq Ft
$258/Sq Ft
Est. Value
About This Home
This home is located at 635 N Salem Ct, Palatine, IL 60074 and is currently estimated at $549,425, approximately $258 per square foot. 635 N Salem Ct is a home located in Cook County with nearby schools including Virginia Lake Elementary School, Walter R. Sundling Junior High School, and Palatine High School.
Ownership History
Date
Name
Owned For
Owner Type
Purchase Details
Closed on
Sep 12, 2000
Sold by
Salva Leonard J and Salva Renee A
Bought by
Ropelewski David F and Ropelewski Karla S
Current Estimated Value
Home Financials for this Owner
Home Financials are based on the most recent Mortgage that was taken out on this home.
Original Mortgage
$130,000
Interest Rate
8.14%
Purchase Details
Closed on
Jun 14, 1996
Sold by
Ferko Gregory P and Ferko Kelly R
Bought by
Salva Leonard and Salva Renee A
Home Financials for this Owner
Home Financials are based on the most recent Mortgage that was taken out on this home.
Original Mortgage
$212,000
Interest Rate
7%
Purchase Details
Closed on
Sep 27, 1995
Sold by
Staudte Gerald K and Staudte Barbara J
Bought by
Ferko Gregory P and Ferko Kelly R
Home Financials for this Owner
Home Financials are based on the most recent Mortgage that was taken out on this home.
Original Mortgage
$203,150
Interest Rate
8%
Create a Home Valuation Report for This Property
The Home Valuation Report is an in-depth analysis detailing your home's value as well as a comparison with similar homes in the area
Home Values in the Area
Average Home Value in this Area
Purchase History
| Date | Buyer | Sale Price | Title Company |
|---|---|---|---|
| Ropelewski David F | $340,000 | -- | |
| Salva Leonard | $279,000 | Chicago Title Insurance Co | |
| Ferko Gregory P | $273,000 | Ati Title Company |
Source: Public Records
Mortgage History
| Date | Status | Borrower | Loan Amount |
|---|---|---|---|
| Closed | Ropelewski David F | $130,000 | |
| Previous Owner | Salva Leonard | $212,000 | |
| Previous Owner | Ferko Gregory P | $203,150 |
Source: Public Records
Tax History Compared to Growth
Tax History
| Year | Tax Paid | Tax Assessment Tax Assessment Total Assessment is a certain percentage of the fair market value that is determined by local assessors to be the total taxable value of land and additions on the property. | Land | Improvement |
|---|---|---|---|---|
| 2024 | $9,982 | $37,033 | $9,880 | $27,153 |
| 2023 | $9,627 | $37,033 | $9,880 | $27,153 |
| 2022 | $9,627 | $37,033 | $9,880 | $27,153 |
| 2021 | $8,346 | $29,029 | $6,175 | $22,854 |
| 2020 | $8,295 | $29,029 | $6,175 | $22,854 |
| 2019 | $8,318 | $32,435 | $6,175 | $26,260 |
| 2018 | $8,403 | $30,476 | $5,557 | $24,919 |
| 2017 | $9,935 | $35,959 | $5,557 | $30,402 |
| 2016 | $9,488 | $35,959 | $5,557 | $30,402 |
| 2015 | $8,989 | $31,879 | $4,940 | $26,939 |
| 2014 | $8,896 | $31,879 | $4,940 | $26,939 |
| 2013 | $8,651 | $31,879 | $4,940 | $26,939 |
Source: Public Records
Map
Nearby Homes
- 240 E Rimini Ct Unit 240
- 915 N Saratoga Dr
- 902 E Plate Dr
- 1 Renaissance Place Unit 3PH
- 1 Renaissance Place Unit 4PH
- 1 Renaissance Place Unit 1121
- 341 N Schiller St
- 922 E Pratt Dr
- 847 E Cooper Dr
- 306 N Bissell Dr
- 856 E Cooper Dr
- 522 E Juniper Dr
- 165 N Mozart St
- 621 E Cunningham Dr
- 1040 E Grissom Dr
- 1133 E Sayles Dr
- 315 N Lytle Dr
- 1163 E Plate Dr
- 8 N Greenwood Ave
- 564 E Princeton St
- 627 N Willow Wood Dr
- 645 N Salem Ct
- 532 E Tahoe Trail
- 512 E Pebble Creek Rd
- 524 E Tahoe Trail
- 540 E Tahoe Trail
- 509 E Pebble Creek Rd
- 647 N Salem Ct
- 649 N Salem Ct
- 651 N Salem Ct
- 548 E Tahoe Trail
- 504 E Pebble Creek Rd
- 538 N Willow Wood Dr
- 473 E Pebble Creek Rd
- 556 E Tahoe Trail
- 472 E Pebble Creek Rd
- 528 N Willow Wood Dr
- 521 N Willow Wood Dr
- 516 N Macarthur Dr
- 467 E Pebble Creek Rd