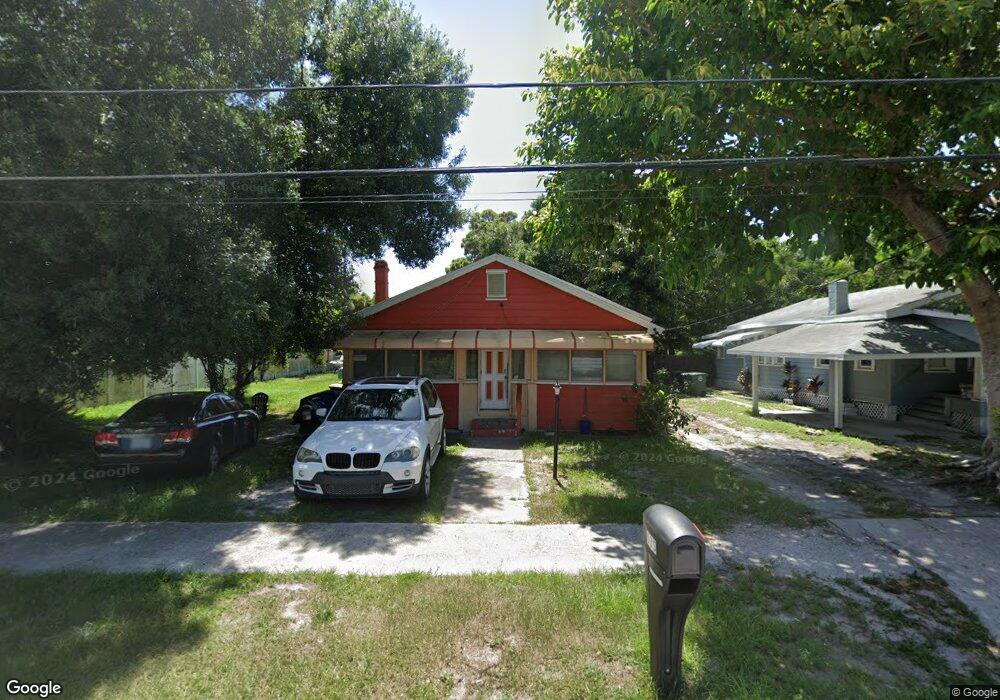
635 S 12th St Fort Pierce, FL 34950
Downtown Fort Pierce NeighborhoodEstimated Value: $160,000 - $256,000
2
Beds
1
Bath
1,468
Sq Ft
$144/Sq Ft
Est. Value
About This Home
This home is located at 635 S 12th St, Fort Pierce, FL 34950 and is currently estimated at $211,869, approximately $144 per square foot. 635 S 12th St is a home located in St. Lucie County with nearby schools including St. Lucie Elementary School, Lawnwood Elementary School, and Chester A. Moore Elementary School.
Ownership History
Date
Name
Owned For
Owner Type
Purchase Details
Closed on
Oct 18, 1996
Sold by
Mcentee John
Bought by
Barron Roberick L and Barron Tawana J
Current Estimated Value
Home Financials for this Owner
Home Financials are based on the most recent Mortgage that was taken out on this home.
Original Mortgage
$41,500
Outstanding Balance
$3,888
Interest Rate
8.32%
Estimated Equity
$207,981
Purchase Details
Closed on
Sep 12, 1996
Sold by
Cisneros Henry G
Bought by
Mcentee John
Home Financials for this Owner
Home Financials are based on the most recent Mortgage that was taken out on this home.
Original Mortgage
$41,500
Outstanding Balance
$3,888
Interest Rate
8.32%
Estimated Equity
$207,981
Purchase Details
Closed on
Jun 5, 1996
Sold by
Clerk Circuit Court
Bought by
United States Amer
Create a Home Valuation Report for This Property
The Home Valuation Report is an in-depth analysis detailing your home's value as well as a comparison with similar homes in the area
Home Values in the Area
Average Home Value in this Area
Purchase History
| Date | Buyer | Sale Price | Title Company |
|---|---|---|---|
| Barron Roberick L | $46,500 | -- | |
| Mcentee John | $23,000 | -- | |
| United States Amer | -- | -- |
Source: Public Records
Mortgage History
| Date | Status | Borrower | Loan Amount |
|---|---|---|---|
| Open | Barron Roberick L | $41,500 |
Source: Public Records
Tax History Compared to Growth
Tax History
| Year | Tax Paid | Tax Assessment Tax Assessment Total Assessment is a certain percentage of the fair market value that is determined by local assessors to be the total taxable value of land and additions on the property. | Land | Improvement |
|---|---|---|---|---|
| 2024 | $357 | $37,883 | -- | -- |
| 2023 | $357 | $36,780 | $0 | $0 |
| 2022 | $332 | $35,709 | $0 | $0 |
| 2021 | $314 | $34,669 | $0 | $0 |
| 2020 | $306 | $34,191 | $0 | $0 |
| 2019 | $288 | $33,423 | $0 | $0 |
| 2018 | $251 | $32,800 | $0 | $0 |
| 2017 | $236 | $59,400 | $13,200 | $46,200 |
| 2016 | $220 | $36,100 | $6,900 | $29,200 |
| 2015 | $217 | $36,200 | $6,900 | $29,300 |
| 2014 | $207 | $31,000 | $0 | $0 |
Source: Public Records
Map
Nearby Homes