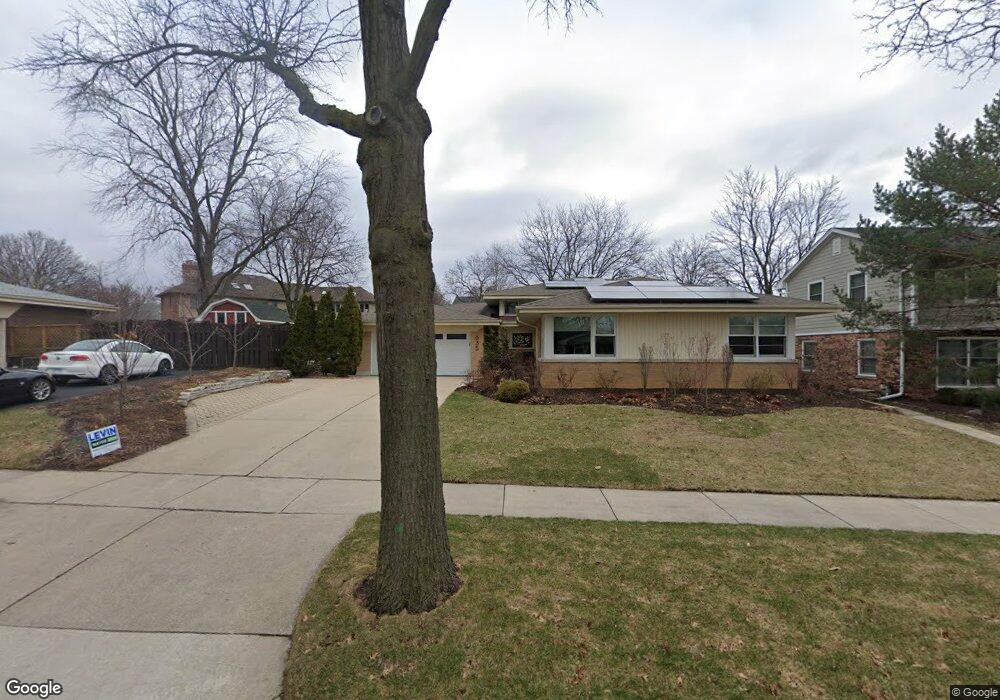
635 S Cedar Ave Elmhurst, IL 60126
Estimated Value: $626,921 - $758,000
--
Bed
--
Bath
1,901
Sq Ft
$366/Sq Ft
Est. Value
About This Home
This home is located at 635 S Cedar Ave, Elmhurst, IL 60126 and is currently estimated at $695,730, approximately $365 per square foot. 635 S Cedar Ave is a home located in DuPage County with nearby schools including Pulaski Intl School of Chicago, Jefferson Elementary School, and Sandburg Middle School.
Ownership History
Date
Name
Owned For
Owner Type
Purchase Details
Closed on
Feb 18, 2000
Sold by
Lasalle Bank National Assn
Bought by
Fisher William L and Fisher Maureen A
Current Estimated Value
Home Financials for this Owner
Home Financials are based on the most recent Mortgage that was taken out on this home.
Original Mortgage
$165,000
Outstanding Balance
$54,983
Interest Rate
8.27%
Estimated Equity
$640,747
Purchase Details
Closed on
Aug 3, 1994
Sold by
Bosman Otto and Kuhr Adri H
Bought by
Lasalle National Trust Na
Purchase Details
Closed on
Mar 31, 1994
Sold by
Bosman Otto
Bought by
Bosman Otto and Kuhr Adri H
Home Financials for this Owner
Home Financials are based on the most recent Mortgage that was taken out on this home.
Original Mortgage
$68,000
Interest Rate
7.35%
Create a Home Valuation Report for This Property
The Home Valuation Report is an in-depth analysis detailing your home's value as well as a comparison with similar homes in the area
Home Values in the Area
Average Home Value in this Area
Purchase History
| Date | Buyer | Sale Price | Title Company |
|---|---|---|---|
| Fisher William L | $330,000 | -- | |
| Lasalle National Trust Na | -- | -- | |
| Bosman Otto | -- | -- |
Source: Public Records
Mortgage History
| Date | Status | Borrower | Loan Amount |
|---|---|---|---|
| Open | Fisher William L | $165,000 | |
| Previous Owner | Bosman Otto | $68,000 |
Source: Public Records
Tax History Compared to Growth
Tax History
| Year | Tax Paid | Tax Assessment Tax Assessment Total Assessment is a certain percentage of the fair market value that is determined by local assessors to be the total taxable value of land and additions on the property. | Land | Improvement |
|---|---|---|---|---|
| 2024 | $10,197 | $177,198 | $111,092 | $66,106 |
| 2023 | $9,462 | $163,860 | $102,730 | $61,130 |
| 2022 | $8,506 | $146,280 | $98,760 | $47,520 |
| 2021 | $8,638 | $149,800 | $96,300 | $53,500 |
| 2020 | $8,390 | $146,520 | $94,190 | $52,330 |
| 2019 | $8,638 | $146,230 | $89,550 | $56,680 |
| 2018 | $9,734 | $163,130 | $84,770 | $78,360 |
| 2017 | $9,522 | $155,450 | $80,780 | $74,670 |
| 2016 | $9,323 | $146,440 | $76,100 | $70,340 |
| 2015 | $9,231 | $136,430 | $70,900 | $65,530 |
| 2014 | $7,852 | $107,890 | $56,270 | $51,620 |
| 2013 | $7,768 | $109,410 | $57,060 | $52,350 |
Source: Public Records
Map
Nearby Homes
- 550 S Hillcrest Ave
- 593 S Edgewood Ave
- 675 S Edgewood Ave
- 705 S Edgewood Ave
- 494 E Atwood Ct
- 505 E Atwood Ct
- 341 E Madison St
- 515 S Parkview Ave
- 562 S Poplar Ave
- 427 E Adams St
- 441 E Adams St
- 274 E Crescent Ave
- 613 S Chatham Ave
- 497 S Stratford Ave
- 522 E Park Manor Ct
- 446 S Stratford Ave
- 5936 W Maple Ave
- 580 S Kearsage Ave
- 5844 W Maple Ave
- 185 E Oneida Ave
- 641 S Cedar Ave
- 410 Crescent
- 625 S Cedar Ave
- 634 S Hillcrest Ave
- 647 S Cedar Ave
- 640 S Hillcrest Ave
- 622 S Hillcrest Ave
- 646 S Hillcrest Ave
- 634 S Cedar Ave
- 630 S Cedar Ave
- 640 S Cedar Ave
- 653 S Cedar Ave
- 386 E Crescent Ave
- 646 S Cedar Ave
- 652 S Hillcrest Ave
- 652 S Cedar Ave
- 659 S Cedar Ave
- 615 S Cedar Ave
- 421 E Crescent Ave
- 658 S Hillcrest Ave