Estimated Value: $382,220 - $448,000
3
Beds
1
Bath
1,008
Sq Ft
$417/Sq Ft
Est. Value
About This Home
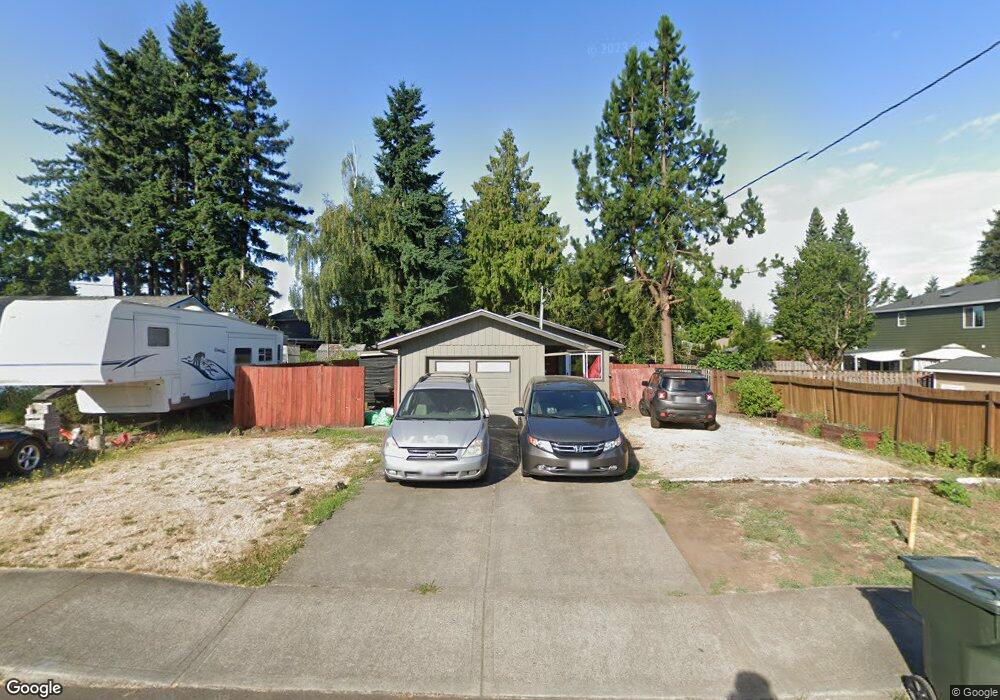
This home is located at 635 S Fir St, Canby, OR 97013 and is currently estimated at $420,055, approximately $416 per square foot. 635 S Fir St is a home located in Clackamas County with nearby schools including Josefa L. Sambrano Elementary School, Philander Lee Elementary School, and Baker Prairie Middle School.
Ownership History
Date
Name
Owned For
Owner Type
Purchase Details
Closed on
Oct 18, 2016
Sold by
Netter Mcrobbie Keeley
Bought by
Netter Mcrobbie Keeley and Ness Scott
Current Estimated Value
Purchase Details
Closed on
Jun 10, 2016
Sold by
Kelso Kathleen A
Bought by
Netter Mcrobbie Keeley M
Home Financials for this Owner
Home Financials are based on the most recent Mortgage that was taken out on this home.
Original Mortgage
$233,689
Outstanding Balance
$186,576
Interest Rate
3.75%
Mortgage Type
FHA
Estimated Equity
$233,479
Purchase Details
Closed on
Oct 20, 2006
Sold by
Knox Theresa M and Knox Alfred B
Bought by
Kelso Kathleen A
Home Financials for this Owner
Home Financials are based on the most recent Mortgage that was taken out on this home.
Original Mortgage
$180,000
Interest Rate
6.5%
Mortgage Type
Purchase Money Mortgage
Create a Home Valuation Report for This Property
The Home Valuation Report is an in-depth analysis detailing your home's value as well as a comparison with similar homes in the area
Home Values in the Area
Average Home Value in this Area
Purchase History
| Date | Buyer | Sale Price | Title Company |
|---|---|---|---|
| Netter Mcrobbie Keeley | -- | None Available | |
| Netter Mcrobbie Keeley M | $238,000 | First American | |
| Kelso Kathleen A | $200,000 | Transnation Title Agency Or |
Source: Public Records
Mortgage History
| Date | Status | Borrower | Loan Amount |
|---|---|---|---|
| Open | Netter Mcrobbie Keeley M | $233,689 | |
| Previous Owner | Kelso Kathleen A | $180,000 |
Source: Public Records
Tax History Compared to Growth
Tax History
| Year | Tax Paid | Tax Assessment Tax Assessment Total Assessment is a certain percentage of the fair market value that is determined by local assessors to be the total taxable value of land and additions on the property. | Land | Improvement |
|---|---|---|---|---|
| 2025 | $2,913 | $164,412 | -- | -- |
| 2024 | $2,831 | $159,624 | -- | -- |
| 2023 | $2,831 | $154,975 | $0 | $0 |
| 2022 | $2,604 | $150,462 | $0 | $0 |
| 2021 | $2,508 | $146,080 | $0 | $0 |
| 2020 | $2,463 | $141,826 | $0 | $0 |
| 2019 | $2,345 | $137,696 | $0 | $0 |
| 2018 | $2,293 | $133,685 | $0 | $0 |
| 2017 | $2,235 | $129,791 | $0 | $0 |
| 2016 | $2,160 | $126,011 | $0 | $0 |
| 2015 | $2,086 | $122,341 | $0 | $0 |
| 2014 | $2,026 | $118,778 | $0 | $0 |
Source: Public Records
Map
Nearby Homes
- 481 S Holly St
- 299 SW 3rd Ave
- 431 SW 3rd Ave
- 574 S Ivy St
- 1491 S Fir St Unit 18
- 1487 S Fir St Unit Lot17
- 1485 S Fir St Unit Lot 16
- 248 SE Township Rd
- 1198 SW 1st Ave
- 1400 S Elm St Unit 91
- 363 SE 7th Ave
- 486 S Knott St
- 385 SE Township Rd
- 331 SE 9th Ave
- 387 SE 7th Ave
- 201 SE 16th Ave
- 476 SW 15th Ave
- 1339 S Baywood Ct
- 423 SE 7th Ave
- 442 SW 15th Ave Unit 15