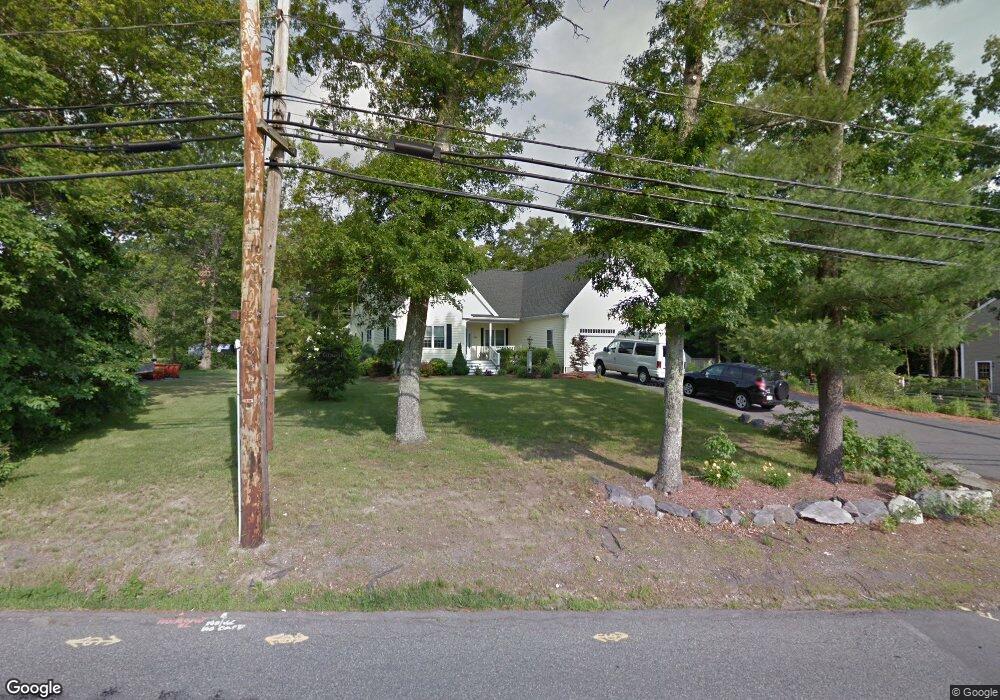
635 South St Bridgewater, MA 02324
Estimated Value: $1,175,699
4
Beds
3
Baths
2,974
Sq Ft
$395/Sq Ft
Est. Value
About This Home
This home is located at 635 South St, Bridgewater, MA 02324 and is currently estimated at $1,175,699, approximately $395 per square foot. 635 South St is a home located in Plymouth County with nearby schools including Mitchell Elementary School, Williams Intermediate School, and Bridgewater Middle School.
Ownership History
Date
Name
Owned For
Owner Type
Purchase Details
Closed on
Aug 17, 2006
Sold by
Bryant John W and Copeland-Bryant Deborah
Bought by
Toward Independent Lt
Current Estimated Value
Home Financials for this Owner
Home Financials are based on the most recent Mortgage that was taken out on this home.
Original Mortgage
$498,400
Outstanding Balance
$301,178
Interest Rate
6.88%
Mortgage Type
Purchase Money Mortgage
Estimated Equity
$874,521
Create a Home Valuation Report for This Property
The Home Valuation Report is an in-depth analysis detailing your home's value as well as a comparison with similar homes in the area
Home Values in the Area
Average Home Value in this Area
Purchase History
| Date | Buyer | Sale Price | Title Company |
|---|---|---|---|
| Toward Independent Lt | $623,000 | -- |
Source: Public Records
Mortgage History
| Date | Status | Borrower | Loan Amount |
|---|---|---|---|
| Open | Toward Independent Lt | $498,400 | |
| Previous Owner | Toward Independent Lt | $100,000 | |
| Previous Owner | Toward Independent Lt | $238,000 |
Source: Public Records
Tax History
| Year | Tax Paid | Tax Assessment Tax Assessment Total Assessment is a certain percentage of the fair market value that is determined by local assessors to be the total taxable value of land and additions on the property. | Land | Improvement |
|---|---|---|---|---|
| 2025 | -- | $755,000 | $190,400 | $564,600 |
| 2024 | -- | $720,900 | $181,300 | $539,600 |
| 2023 | $0 | $680,500 | $169,400 | $511,100 |
| 2022 | $0 | $603,100 | $148,600 | $454,500 |
| 2021 | $0 | $563,200 | $132,700 | $430,500 |
| 2020 | $0 | $546,900 | $127,600 | $419,300 |
| 2019 | $0 | $532,200 | $127,600 | $404,600 |
| 2018 | $0 | $511,300 | $123,900 | $387,400 |
| 2017 | $0 | $474,600 | $123,900 | $350,700 |
| 2016 | -- | $453,600 | $121,500 | $332,100 |
| 2015 | -- | $435,400 | $117,900 | $317,500 |
| 2014 | -- | $426,600 | $114,500 | $312,100 |
Source: Public Records
Map
Nearby Homes
- 65 Harvest Ln
- 1 Jennifer Cir
- 1 Anacki Ln Unit 24
- 51 Cottage St
- 35 Stockbridge Rd
- 220 Bedford St Unit 32
- 8 North St
- 120 Worcester St
- 118 Plesant St
- 35 Leonard St Unit 3
- 302 Pleasant St
- 35 Nelson Dr
- 0 Bedford St Unit 73480500
- 557 Forest St
- 260 Boxwood Ln
- Lot 2 Fontana Way
- 5 Heather Ln
- 180 Main St Unit 6109
- 180 Main St Unit 4105
- 47 Hale St
Your Personal Tour Guide
Ask me questions while you tour the home.