635 Treyburn Manor Dr Alpharetta, GA 30004
Estimated Value: $1,249,124 - $1,433,000
4
Beds
5
Baths
3,408
Sq Ft
$391/Sq Ft
Est. Value
About This Home
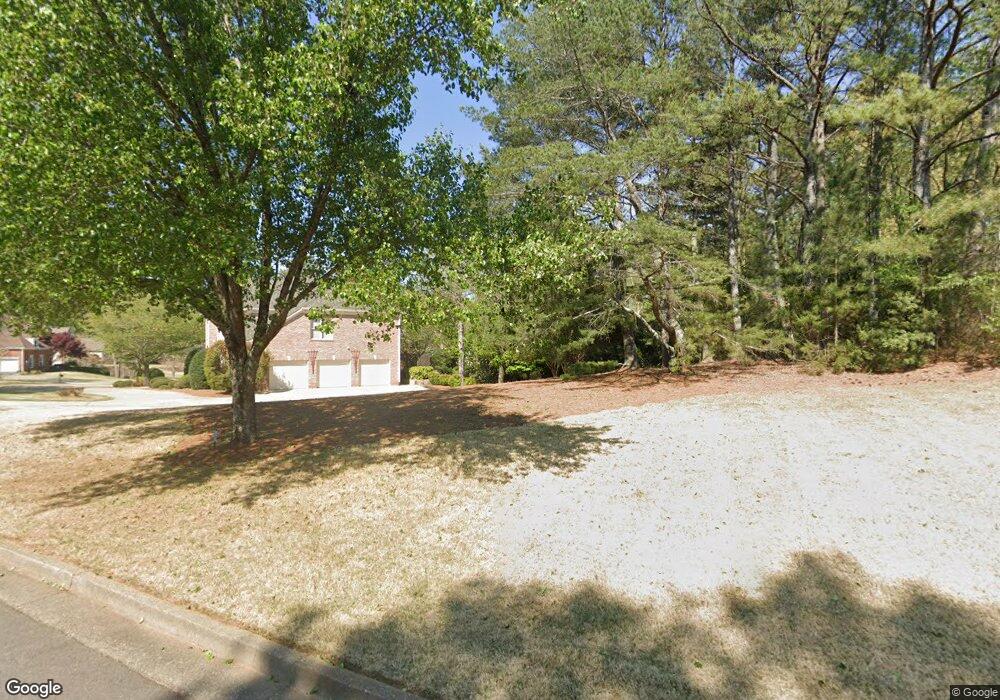
This home is located at 635 Treyburn Manor Dr, Alpharetta, GA 30004 and is currently estimated at $1,331,531, approximately $390 per square foot. 635 Treyburn Manor Dr is a home located in Fulton County with nearby schools including Birmingham Falls Elementary School, Northwestern Middle School, and Cambridge High School.
Ownership History
Date
Name
Owned For
Owner Type
Purchase Details
Closed on
Apr 27, 2011
Sold by
Prudential Relocation Inc
Bought by
Schmidt John C and Schmidt Diane M
Current Estimated Value
Purchase Details
Closed on
May 4, 2005
Sold by
Katz David M
Bought by
Katz David M and Katz Daphne
Home Financials for this Owner
Home Financials are based on the most recent Mortgage that was taken out on this home.
Original Mortgage
$300,000
Interest Rate
5.66%
Mortgage Type
New Conventional
Purchase Details
Closed on
Nov 20, 1997
Sold by
Crawley Enterprises Inc
Bought by
Jarvis James K and Jarvis Lynn
Home Financials for this Owner
Home Financials are based on the most recent Mortgage that was taken out on this home.
Original Mortgage
$238,900
Interest Rate
7.23%
Mortgage Type
New Conventional
Create a Home Valuation Report for This Property
The Home Valuation Report is an in-depth analysis detailing your home's value as well as a comparison with similar homes in the area
Home Values in the Area
Average Home Value in this Area
Purchase History
| Date | Buyer | Sale Price | Title Company |
|---|---|---|---|
| Schmidt John C | $530,000 | -- | |
| Prudential Relocation Inc | $530,000 | -- | |
| Katz David M | -- | -- | |
| Katz David M | $599,600 | -- | |
| Jarvis James K | $459,900 | -- |
Source: Public Records
Mortgage History
| Date | Status | Borrower | Loan Amount |
|---|---|---|---|
| Previous Owner | Katz David M | $300,000 | |
| Previous Owner | Jarvis James K | $238,900 |
Source: Public Records
Tax History Compared to Growth
Tax History
| Year | Tax Paid | Tax Assessment Tax Assessment Total Assessment is a certain percentage of the fair market value that is determined by local assessors to be the total taxable value of land and additions on the property. | Land | Improvement |
|---|---|---|---|---|
| 2025 | $1,202 | $436,280 | $143,600 | $292,680 |
| 2023 | $10,183 | $360,760 | $81,280 | $279,480 |
| 2022 | $5,939 | $260,440 | $72,960 | $187,480 |
| 2021 | $5,573 | $218,040 | $60,320 | $157,720 |
| 2020 | $5,781 | $223,800 | $65,760 | $158,040 |
| 2019 | $1,135 | $226,720 | $58,480 | $168,240 |
| 2018 | $5,730 | $221,440 | $57,120 | $164,320 |
| 2017 | $5,143 | $221,440 | $57,120 | $164,320 |
| 2016 | $6,118 | $235,320 | $65,800 | $169,520 |
| 2015 | $7,183 | $235,320 | $65,800 | $169,520 |
| 2014 | $5,799 | $206,960 | $63,160 | $143,800 |
Source: Public Records
Map
Nearby Homes
- 1160 Nix Rd
- 325 White Columns Ct
- 15475 Birmingham Hwy
- 310 Glen Hampton Place
- 1004 Crossroads Trail
- 115 von Lake Dr
- 1009 Crossroads Trail
- 110 von Lake Dr
- 1013 Crossroads Trail
- 711 Hallbrook Ct
- 15630 Birmingham Hwy
- 1025 Crossroads Trail
- 2035 Village Walk
- 2031 Village Walk
- 15380 Birmingham Hwy
- 15750 Freemanville Rd
- 225 Brock Trail Unit 2
- 225 Brock Trail
- 240 Brock Trail
- 240 Brock Trail Unit 4
- 500 Treyburn View
- 510 Treyburn View
- 305 Galloway View Unit IIIA
- 0 Galloway View
- 620 Treyburn Manor Dr
- 0 Treyburn View
- 1000 Treyburn Run
- 520 Treyburn View Unit 3A
- 315 Galloway View
- 515 Treyburn View Unit 3A
- 990 Treyburn Run Unit 3B
- 505 Treyburn View Unit 3A
- 310 Galloway View
- 980 Treyburn Run
- 980 Treyburn Run Unit 3B
- 1020 Treyburn Run Unit 3B
- 530 Treyburn View Unit IIIA
- 600 Treyburn Manor Dr
- 525 Treyburn View Unit 3A
- 970 Treyburn Run Unit IIIB