NOT LISTED FOR SALE

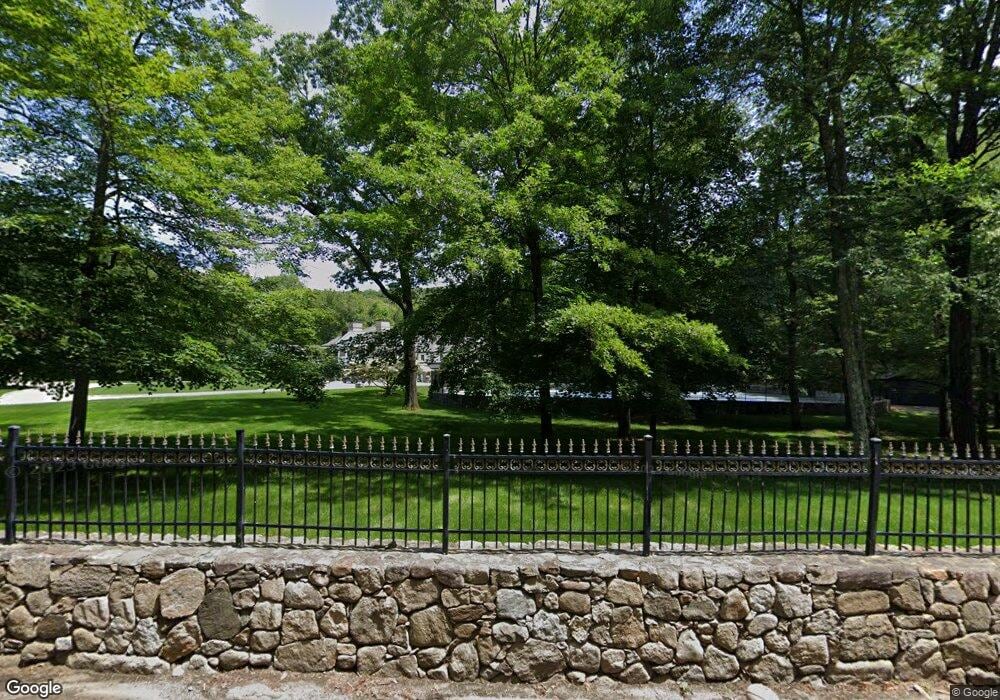
635 Valley Rd New Canaan, CT 06840

Estimated Value: $3,798,000 - $4,759,236

5 Beds
7 Baths
6,000 Sq Ft
$705/Sq Ft Est. Value

About This Home

This home is located at 635 Valley Rd, New Canaan, CT 06840 and is currently estimated at $4,231,059, approximately $705 per square foot. 635 Valley Rd is a home located in Fairfield County with nearby schools including East Elementary School, Saxe Middle School, and New Canaan High School.

Ownership History

Date Name Owned For Owner Type

Purchase Details

Closed on
Feb 26, 2013
Sold by
Us Bank Na
Bought by
Zang Michael Y and Luo Lu
Current Estimated Value
$4,231,059

Purchase Details

Closed on
May 14, 2012
Sold by
Mcconnaughy John E
Bought by
Us Bank Na

Purchase Details

Closed on
Mar 26, 2003
Sold by
Lopez Pedru A and Lopez Andrea Pm
Bought by
Inatl Relocation R

Purchase Details

Closed on
Feb 27, 1995
Sold by
Salem Wanda M and Salem Aiman
Bought by
Delopez Andrea Pm and Lopez Petro A

Purchase Details

Closed on
Nov 14, 1994
Sold by
Reighley H Ward and Reighley Patricia
Bought by
Pets Choice

Purchase Details

Closed on
Jul 5, 1988
Sold by
Ratick Dean
Bought by
Sanders Tom L
Source: Public Records

Range of Values:

Collateral Analytics

Collateral Analytics Collateral Analytics AVMs (Automated Valuation Model) employ a number of statistical approaches combined with neighborhood-specific comparable selection guarantees the most up-to-date and precise valuations.

Not Available

Collateral Analytics does not have data for the current month. Please view the chart for historical values.

ICE

ICE Mortgage Technology ICE Mortgage Technology’s AVM (Automated Valuation Model) is a state-of-the-art online residential property valuation tool that provides a quick and accurate estimate of the value of almost any home in the U.S.

Not Available

ICE Mortgage Technology does not have data for the current month. Please view the chart for historical values.

First American

First American First American Data & Analytics’ next-generation AVM combines unrivaled data assets with a blended ensemble of valuation models to produce highly accurate, reliable valuations you can trust.

Not Available

First American does not have data for the current month. Please view the chart for historical values.

Quantarium

Quantarium Quantarium’s valuation service, repeatedly proven the industry’s most accurate and comprehensive, is supercharged with a self-learning and auto-tuning AI engine that continually becomes smarter and more accurate as it processes daily inputs from the industry’s leading RE data lake.

Not Available

Quantarium does not have data for the current month. Please view the chart for historical values.

Average Value
Not Available
List Price
Sold Price
Create a Home Valuation Report for This Property
The Home Valuation Report is an in-depth analysis detailing your home's value as well as a comparison with similar homes in the area

Home Values in the Area

Source: Public Records

Average Home Value in this Area


Source: Public Records

Purchase History

Date Buyer Sale Price Title Company
Zang Michael Y $2,100,000 --
Us Bank Na -- --
Inatl Relocation R $525,000 --
Delopez Andrea Pm $340,000 --
Pets Choice $1,500,000 --
Sanders Tom L $209,900 --
Source: Public Records

Mortgage History

Date Status Borrower Loan Amount
Open Darnall Theodore $2,000,000
Previous Owner Sanders Tom L $1,500,000
Previous Owner Sanders Tom L $5,400,000
Source: Public Records

Tax History Compared to Growth

Source: Public Records

Tax History

Year Tax Paid Tax Assessment Tax Assessment Total Assessment is a certain percentage of the fair market value that is determined by local assessors to be the total taxable value of land and additions on the property. Land Improvement
2024 $63,303 $3,922,100 $907,200 $3,014,900
2023 $60,187 $3,177,790 $777,140 $2,400,650
2022 $58,376 $3,177,790 $777,140 $2,400,650
2021 $57,709 $3,177,790 $777,140 $2,400,650
2020 $57,709 $3,177,790 $777,140 $2,400,650
2019 $57,963 $3,177,790 $777,140 $2,400,650
2018 $63,059 $3,718,120 $1,139,040 $2,579,080
2017 $61,981 $3,718,120 $1,139,040 $2,579,080
2016 $60,643 $3,718,120 $1,139,040 $2,579,080
2015 $59,453 $3,718,120 $1,139,040 $2,579,080
2014 $57,780 $3,718,120 $1,139,040 $2,579,080
Source: Public Records

Map