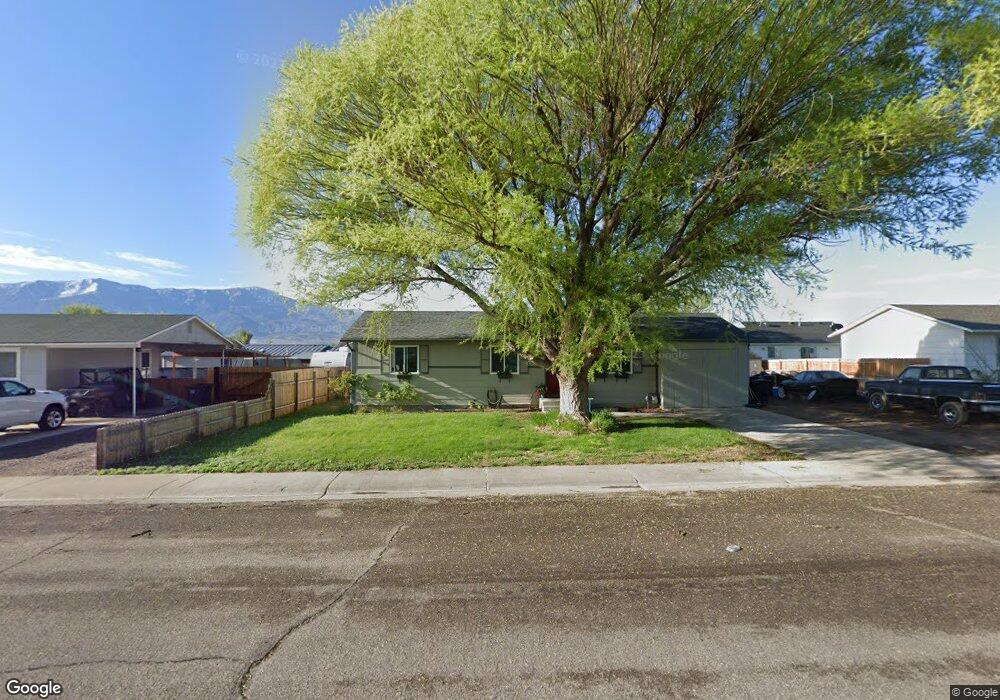
635 W 1050 S Richfield, UT 84701
Estimated Value: $299,365 - $365,000
--
Bed
--
Bath
1,008
Sq Ft
$328/Sq Ft
Est. Value
About This Home
This home is located at 635 W 1050 S, Richfield, UT 84701 and is currently estimated at $330,591, approximately $327 per square foot. 635 W 1050 S is a home located in Sevier County with nearby schools including Ashman School, Pahvant School, and Red Hills Middle School.
Ownership History
Date
Name
Owned For
Owner Type
Purchase Details
Closed on
Apr 20, 2017
Sold by
Vandemyle Jacob and Vandemyle Jennifer
Bought by
Vandemyle Jacob and Vandemyle Jennifer K
Current Estimated Value
Home Financials for this Owner
Home Financials are based on the most recent Mortgage that was taken out on this home.
Original Mortgage
$120,000
Interest Rate
4.21%
Purchase Details
Closed on
Jan 22, 2008
Sold by
Payne Jennifer Kim and Vandemyle Jennifer
Bought by
Vandemyle Jacob and Vandemyle Jennifer
Home Financials for this Owner
Home Financials are based on the most recent Mortgage that was taken out on this home.
Original Mortgage
$119,000
Interest Rate
6.07%
Create a Home Valuation Report for This Property
The Home Valuation Report is an in-depth analysis detailing your home's value as well as a comparison with similar homes in the area
Home Values in the Area
Average Home Value in this Area
Purchase History
| Date | Buyer | Sale Price | Title Company |
|---|---|---|---|
| Vandemyle Jacob | -- | First American Title Company | |
| Vandemyle Jacob | -- | None Available |
Source: Public Records
Mortgage History
| Date | Status | Borrower | Loan Amount |
|---|---|---|---|
| Previous Owner | Vandemyle Jacob | $120,000 | |
| Previous Owner | Vandemyle Jacob | $119,000 |
Source: Public Records
Tax History Compared to Growth
Tax History
| Year | Tax Paid | Tax Assessment Tax Assessment Total Assessment is a certain percentage of the fair market value that is determined by local assessors to be the total taxable value of land and additions on the property. | Land | Improvement |
|---|---|---|---|---|
| 2024 | $1,514 | $152,991 | $37,139 | $115,852 |
| 2023 | $0 | $160,378 | $32,803 | $127,575 |
| 2022 | $1,058 | $134,407 | $31,560 | $102,847 |
| 2021 | $1,058 | $109,387 | $29,605 | $79,782 |
| 2020 | $1,058 | $83,657 | $13,200 | $70,457 |
| 2019 | $1,069 | $75,740 | $11,000 | $64,740 |
| 2018 | $0 | $66,590 | $11,000 | $55,590 |
| 2017 | $912 | $60,870 | $11,000 | $49,870 |
| 2016 | -- | $60,870 | $0 | $0 |
| 2015 | -- | $59,790 | $0 | $0 |
| 2014 | -- | $56,960 | $0 | $0 |
Source: Public Records
Map
Nearby Homes
- 554 W 1000 S
- 837 610 W
- 765 W 1100 S
- 669 Ogden Dr
- 0 Parcel #1-7-73 Unit 25-261286
- 0 Parcel #1-2-57 Unit 25-261285
- 528 W 650 S
- 330 W 700 S
- 1058 W 820 S Unit 202
- 250 W 700 S
- 153 W 800 S
- 581 S 200 W
- 902 W Southern Hills Vista
- 690 1100 S
- 553 S 100 W Unit 304
- 553 S 100 W Unit 202
- 553 S 100 W Unit 204
- 553 S 100 W Unit 104
- 553 S 100 W Unit 103
- 553 S 100 W Unit 203