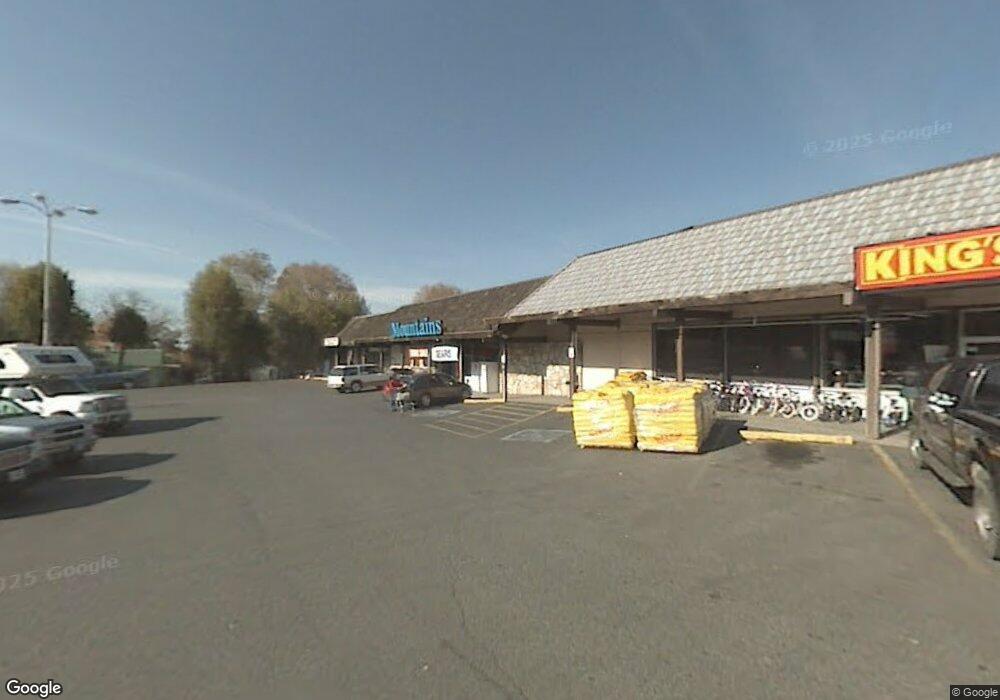
635 W Main St John Day, OR 97845
Estimated Value: $448,021
--
Bed
--
Bath
9,000
Sq Ft
$50/Sq Ft
Est. Value
About This Home
This home is located at 635 W Main St, John Day, OR 97845 and is currently estimated at $448,021, approximately $49 per square foot. 635 W Main St is a home located in Grant County with nearby schools including Grant Union Junior/Senior High School.
Ownership History
Date
Name
Owned For
Owner Type
Purchase Details
Closed on
Jan 26, 2022
Sold by
Cowanthompson Robert F
Bought by
Cowanthompson Family Trust
Current Estimated Value
Purchase Details
Closed on
Dec 30, 2019
Sold by
Nydam John W and Nydam Janis M
Bought by
Cowanthompson Robert F and Cowanthompson Kay M
Home Financials for this Owner
Home Financials are based on the most recent Mortgage that was taken out on this home.
Original Mortgage
$290,000
Interest Rate
3.7%
Mortgage Type
Seller Take Back
Create a Home Valuation Report for This Property
The Home Valuation Report is an in-depth analysis detailing your home's value as well as a comparison with similar homes in the area
Home Values in the Area
Average Home Value in this Area
Purchase History
| Date | Buyer | Sale Price | Title Company |
|---|---|---|---|
| Cowanthompson Family Trust | -- | None Listed On Document | |
| Cowanthompson Robert F | $315,000 | Land Ttl Co Of Grant Cnty In |
Source: Public Records
Mortgage History
| Date | Status | Borrower | Loan Amount |
|---|---|---|---|
| Previous Owner | Cowanthompson Robert F | $290,000 |
Source: Public Records
Tax History Compared to Growth
Tax History
| Year | Tax Paid | Tax Assessment Tax Assessment Total Assessment is a certain percentage of the fair market value that is determined by local assessors to be the total taxable value of land and additions on the property. | Land | Improvement |
|---|---|---|---|---|
| 2024 | $4,471 | $297,350 | $81,730 | $215,620 |
| 2023 | $4,133 | $275,310 | $75,670 | $199,640 |
| 2022 | $3,715 | $248,030 | $68,180 | $179,850 |
| 2021 | $3,558 | $236,220 | $64,930 | $171,290 |
| 2020 | $3,796 | $233,880 | $64,290 | $169,590 |
| 2019 | $3,771 | $233,880 | $64,290 | $169,590 |
| 2018 | $9,116 | $244,120 | $63,520 | $180,600 |
| 2017 | $4,882 | $301,990 | $63,520 | $238,470 |
| 2016 | $4,887 | $301,990 | $63,520 | $238,470 |
| 2015 | $5,379 | $333,550 | $67,520 | $266,030 |
| 2014 | $5,379 | $333,550 | $67,520 | $266,030 |
| 2013 | $5,397 | $347,440 | $70,330 | $277,110 |
Source: Public Records
Map
Nearby Homes
- 0 W Seventh St
- 314 NW 3rd Ave
- 213 NW 4th Ave
- 227 NW 2nd Ave
- 212 NW 5th Ave
- 410 NW Bridge St
- 212 NW Bridge St
- 434 NW Charolais Heights
- 111 Valley View Dr
- 312 N Canyon Blvd
- 310 N Canyon Blvd
- 128 SW Canton St
- 173 N Canyon Blvd
- 219 Valley View Dr
- 250 NE Dayton St
- 0 NE 7th St
- 227 Valley View Dr
- 229 Valley View Dr
- 0 SW 4th Ave Unit 24562517