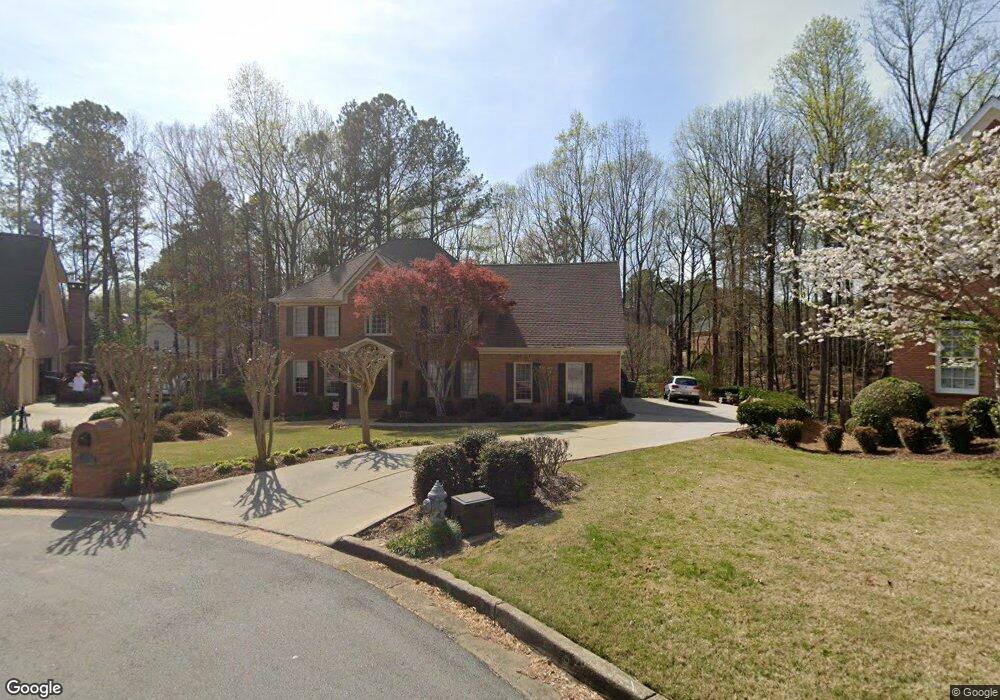
635 Winans Walk Unit 1 Alpharetta, GA 30022
Estimated Value: $866,794 - $1,014,000
5
Beds
4
Baths
3,372
Sq Ft
$271/Sq Ft
Est. Value
About This Home
This home is located at 635 Winans Walk Unit 1, Alpharetta, GA 30022 and is currently estimated at $914,949, approximately $271 per square foot. 635 Winans Walk Unit 1 is a home located in Fulton County with nearby schools including Ocee Elementary School, Taylor Road Middle School, and Chattahoochee High School.
Ownership History
Date
Name
Owned For
Owner Type
Purchase Details
Closed on
Apr 17, 2002
Sold by
Boosinger Jonathan W and Boosinger Cathy B
Bought by
Feckory Kevin G and Feckory Deanna W
Current Estimated Value
Home Financials for this Owner
Home Financials are based on the most recent Mortgage that was taken out on this home.
Original Mortgage
$290,000
Outstanding Balance
$120,905
Interest Rate
6.89%
Mortgage Type
New Conventional
Estimated Equity
$794,044
Purchase Details
Closed on
Aug 19, 1993
Sold by
Lewis Newman Inc
Bought by
Boosinger Jonathan W Cathy B
Home Financials for this Owner
Home Financials are based on the most recent Mortgage that was taken out on this home.
Original Mortgage
$244,800
Interest Rate
7.18%
Create a Home Valuation Report for This Property
The Home Valuation Report is an in-depth analysis detailing your home's value as well as a comparison with similar homes in the area
Home Values in the Area
Average Home Value in this Area
Purchase History
| Date | Buyer | Sale Price | Title Company |
|---|---|---|---|
| Feckory Kevin G | $380,000 | -- | |
| Boosinger Jonathan W Cathy B | $272,000 | -- |
Source: Public Records
Mortgage History
| Date | Status | Borrower | Loan Amount |
|---|---|---|---|
| Open | Feckory Kevin G | $290,000 | |
| Previous Owner | Boosinger Jonathan W Cathy B | $244,800 |
Source: Public Records
Tax History Compared to Growth
Tax History
| Year | Tax Paid | Tax Assessment Tax Assessment Total Assessment is a certain percentage of the fair market value that is determined by local assessors to be the total taxable value of land and additions on the property. | Land | Improvement |
|---|---|---|---|---|
| 2025 | $1,189 | $369,680 | $101,880 | $267,800 |
| 2023 | $9,360 | $331,600 | $74,320 | $257,280 |
| 2022 | $5,371 | $262,880 | $50,480 | $212,400 |
| 2021 | $6,371 | $229,920 | $49,080 | $180,840 |
| 2020 | $6,410 | $227,160 | $48,480 | $178,680 |
| 2019 | $1,016 | $230,600 | $45,320 | $185,280 |
| 2018 | $5,669 | $225,160 | $44,240 | $180,920 |
| 2017 | $5,318 | $198,000 | $27,160 | $170,840 |
| 2016 | $5,159 | $193,440 | $27,160 | $166,280 |
| 2015 | $6,090 | $193,440 | $27,160 | $166,280 |
| 2014 | $4,134 | $147,600 | $30,240 | $117,360 |
Source: Public Records
Map
Nearby Homes
- 11070 Pinewalk Forest Cir
- 285 Rolling Mist Ct
- 10530 Tuxford Dr
- 710 Country Manor Way
- 105 Kimball Bridge Cove
- 4475 Hawthorn Cir
- 4465 Hawthorn Cir
- 4462 Hawthorn Cir
- 10515 Colony Glen Dr Unit 2
- 130 Colony Run
- 3962 Erin Dr
- 10880 Windham Way
- 10405 Meadow Crest Ln
- 4305 Pine Vista Blvd
- 517 Boardwalk Way
- 515 Boardwalk Way
- 345 Kincardine Way Unit IIIA
- 10325 Oxford Mill Cir Unit 1
- 630 Winans Walk Unit X
- 625 Winans Walk Unit X
- 10415 Tuxford Dr
- 870 Ramsden Run Unit VII
- 880 Ramsden Run
- 10405 Tuxford Dr
- 615 Winans Walk
- 535 Tadfield Trace
- 860 Ramsden Run
- 610 Winans Walk Unit X
- 620 Winans Walk
- 525 Tadfield Trace
- 890 Ramsden Run
- 10395 Tuxford Dr
- 515 Tadfield Trace Unit 7
- 605 Winans Walk
- 10750 Carrara Cove
- 10400 Tuxford Dr
- 850 Ramsden Run
- 545 Tadfield Trace