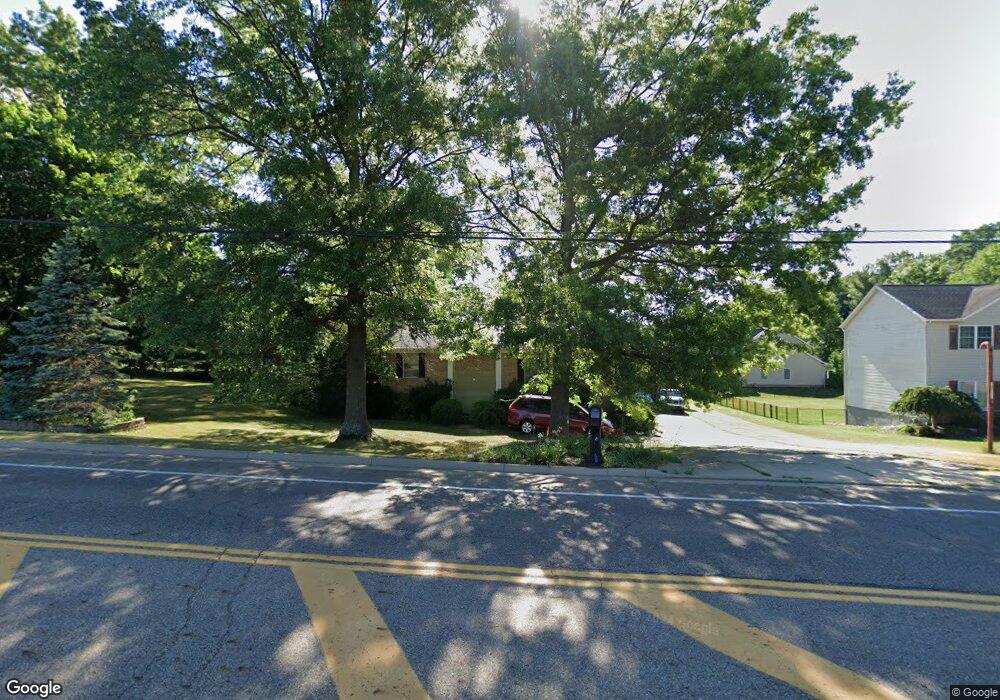
6350 Arlington Ave NW Massillon, OH 44646
Amherst Heights-Clearview NeighborhoodEstimated Value: $276,000 - $311,000
3
Beds
2
Baths
1,932
Sq Ft
$151/Sq Ft
Est. Value
About This Home
This home is located at 6350 Arlington Ave NW, Massillon, OH 44646 and is currently estimated at $292,440, approximately $151 per square foot. 6350 Arlington Ave NW is a home located in Stark County with nearby schools including Sauder Elementary School, Jackson Memorial Middle School, and Jackson High School.
Ownership History
Date
Name
Owned For
Owner Type
Purchase Details
Closed on
Jun 3, 2009
Sold by
Peel William C
Bought by
Nguyen Hieu Chi
Current Estimated Value
Home Financials for this Owner
Home Financials are based on the most recent Mortgage that was taken out on this home.
Original Mortgage
$135,401
Outstanding Balance
$85,917
Interest Rate
4.85%
Mortgage Type
FHA
Estimated Equity
$206,523
Purchase Details
Closed on
Aug 2, 2002
Sold by
Timberidge Enterprises Ltd
Bought by
Peel William C
Home Financials for this Owner
Home Financials are based on the most recent Mortgage that was taken out on this home.
Original Mortgage
$150,100
Interest Rate
6.7%
Mortgage Type
Purchase Money Mortgage
Purchase Details
Closed on
Jan 10, 2000
Sold by
Heim Robyn E
Bought by
Timberidge Enterprises Ltd
Purchase Details
Closed on
Aug 18, 1998
Sold by
Harrold Walter C
Bought by
Timberidge Enterprises Ltd
Purchase Details
Closed on
May 29, 1998
Sold by
Mackey Neil R
Bought by
Timberidge Enterprises Ltd
Purchase Details
Closed on
May 15, 1995
Sold by
Miller Helen M
Bought by
Mackey Neil R and Mackey Ty
Create a Home Valuation Report for This Property
The Home Valuation Report is an in-depth analysis detailing your home's value as well as a comparison with similar homes in the area
Home Values in the Area
Average Home Value in this Area
Purchase History
| Date | Buyer | Sale Price | Title Company |
|---|---|---|---|
| Nguyen Hieu Chi | $137,900 | Attorney | |
| Peel William C | $158,000 | -- | |
| Timberidge Enterprises Ltd | $165,000 | -- | |
| Timberidge Enterprises Ltd | $200,529 | -- | |
| Timberidge Enterprises Ltd | $968,000 | -- | |
| Mackey Neil R | $279,901 | -- |
Source: Public Records
Mortgage History
| Date | Status | Borrower | Loan Amount |
|---|---|---|---|
| Open | Nguyen Hieu Chi | $135,401 | |
| Previous Owner | Peel William C | $150,100 |
Source: Public Records
Tax History Compared to Growth
Tax History
| Year | Tax Paid | Tax Assessment Tax Assessment Total Assessment is a certain percentage of the fair market value that is determined by local assessors to be the total taxable value of land and additions on the property. | Land | Improvement |
|---|---|---|---|---|
| 2025 | -- | $56,740 | $48,480 | $8,260 |
| 2024 | -- | $56,740 | $48,480 | $8,260 |
| 2023 | $2,209 | $52,930 | $45,120 | $7,810 |
| 2022 | $2,221 | $52,930 | $45,120 | $7,810 |
| 2021 | $2,221 | $52,930 | $45,120 | $7,810 |
| 2020 | $2,216 | $49,110 | $38,890 | $10,220 |
| 2019 | $2,135 | $49,120 | $38,890 | $10,230 |
| 2018 | $2,146 | $49,120 | $38,890 | $10,230 |
| 2017 | $2,042 | $45,260 | $35,180 | $10,080 |
| 2016 | $2,540 | $45,260 | $35,180 | $10,080 |
| 2015 | $2,571 | $45,260 | $35,180 | $10,080 |
| 2014 | $427 | $40,850 | $31,750 | $9,100 |
| 2013 | $1,195 | $40,850 | $31,750 | $9,100 |
Source: Public Records
Map
Nearby Homes
- 8028 Clifton Court Cir NW
- 7750 Killeen St NW
- 8322 Forest Ridge St NW
- 8073 Grayson Green St NW
- 7412 Klingston St NW
- 5679 Carters Grove Cir NW
- 8079 Windward Trace Cir NW
- 6281 Champion Ave NW
- 6519 Lorraine Ave NW
- 6116 Kirknewton Cir NW
- 6541 Lorraine Ave NW
- 6540 Lorraine Ave NW
- 8259 Buckingham Cir NW
- 7087 Emerson Cir NW
- 8872 Franklin St NW
- 7316 Bentham Cir NW
- 8920 Franklin NW
- 7035 Harvey Ave NW Unit 9
- 8932 Camden Rd NW
- 9042 Wolocott St NW
- 6330 Arlington Ave NW
- 8003 Killeen St NW
- 8025 Killeen St NW
- 7988 Killeen St NW
- 7981 Killeen St NW
- 7963 Killeen St NW
- 7974 Killeen St NW
- 6452 Arlington Ave NW
- 8001 Mudbrook St NW
- 7946 Killeen St NW
- 6365 Kilkenny Cir NW
- 6373 Kilkenny Cir NW
- 8084 Mudbrook St NW
- 7985 Mudbrook Rd NW
- 7924 Killeen St NW
- 0 Kilkenny Cir NW
- 7967 Mudbrook Rd NW
- 6379 Kilkenny Cir NW
- 7902 Killeen St NW
- 6464 Arlington Ave NW