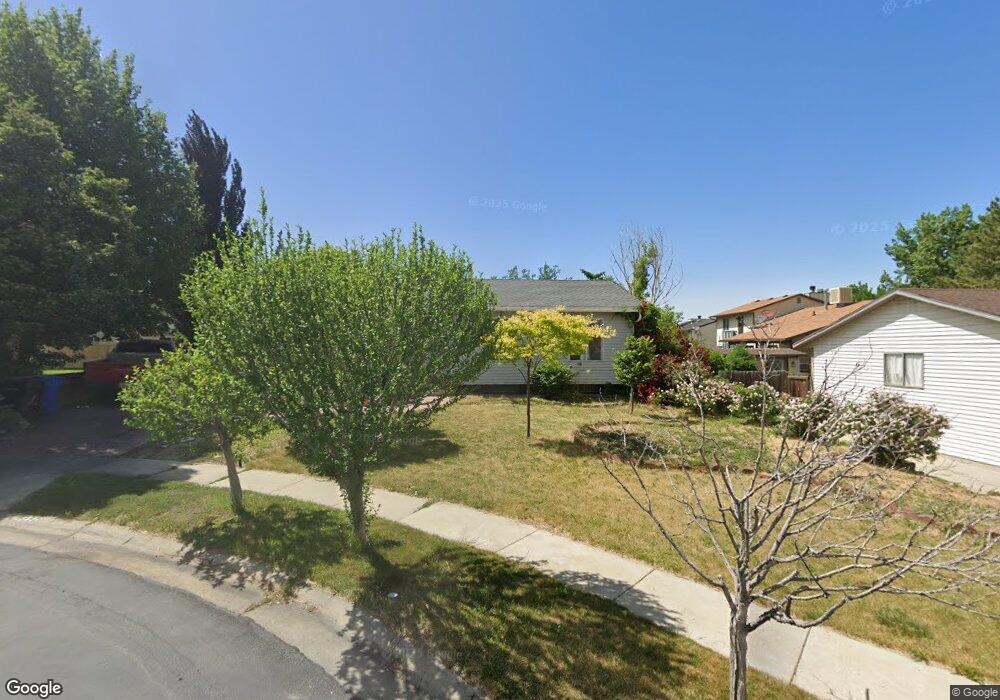
6352 S Moki Cir West Jordan, UT 84081
Oquirrh NeighborhoodEstimated Value: $462,000 - $477,558
5
Beds
2
Baths
2,042
Sq Ft
$230/Sq Ft
Est. Value
About This Home
This home is located at 6352 S Moki Cir, West Jordan, UT 84081 and is currently estimated at $469,390, approximately $229 per square foot. 6352 S Moki Cir is a home located in Salt Lake County with nearby schools including Jim Bridger Elementary School, Thomas Jefferson Jr High School, and Kearns High School.
Ownership History
Date
Name
Owned For
Owner Type
Purchase Details
Closed on
Nov 6, 2025
Sold by
Hernandez Camilo and Hernandez Maria Mendiola
Bought by
Stanger Coleman Vaughn and Mestre Arianna Virginia Sta
Current Estimated Value
Home Financials for this Owner
Home Financials are based on the most recent Mortgage that was taken out on this home.
Original Mortgage
$432,250
Outstanding Balance
$432,250
Interest Rate
6.3%
Mortgage Type
New Conventional
Estimated Equity
$37,140
Purchase Details
Closed on
Jul 6, 2022
Sold by
Lund and Amber
Bought by
Hernandez Camilo and Hernandez Maria Mendiola
Home Financials for this Owner
Home Financials are based on the most recent Mortgage that was taken out on this home.
Original Mortgage
$321,750
Interest Rate
5.09%
Mortgage Type
New Conventional
Purchase Details
Closed on
Jun 3, 2016
Sold by
Osborn Patrick P and Osborn Kiana
Bought by
Lund Mark and Lund Amber
Home Financials for this Owner
Home Financials are based on the most recent Mortgage that was taken out on this home.
Original Mortgage
$226,000
Interest Rate
3.59%
Mortgage Type
New Conventional
Purchase Details
Closed on
Jul 10, 2009
Sold by
Young Robert S
Bought by
Osborn Patricia P and Osborn Kiana
Home Financials for this Owner
Home Financials are based on the most recent Mortgage that was taken out on this home.
Original Mortgage
$191,468
Interest Rate
5.25%
Mortgage Type
FHA
Create a Home Valuation Report for This Property
The Home Valuation Report is an in-depth analysis detailing your home's value as well as a comparison with similar homes in the area
Home Values in the Area
Average Home Value in this Area
Purchase History
| Date | Buyer | Sale Price | Title Company |
|---|---|---|---|
| Hernandez Camilo | -- | Vanguard Title | |
| Lund Mark | -- | Meridian Title | |
| Osborn Patricia P | -- | United Title Services |
Source: Public Records
Mortgage History
| Date | Status | Borrower | Loan Amount |
|---|---|---|---|
| Open | Hernandez Camilo | $321,750 | |
| Previous Owner | Lund Mark | $226,000 | |
| Previous Owner | Osborn Patricia P | $191,468 |
Source: Public Records
Tax History Compared to Growth
Tax History
| Year | Tax Paid | Tax Assessment Tax Assessment Total Assessment is a certain percentage of the fair market value that is determined by local assessors to be the total taxable value of land and additions on the property. | Land | Improvement |
|---|---|---|---|---|
| 2025 | $2,692 | $450,100 | $151,700 | $298,400 |
| 2024 | $2,692 | $424,400 | $143,100 | $281,300 |
| 2023 | $2,654 | $398,400 | $137,600 | $260,800 |
| 2022 | $2,590 | $395,600 | $134,900 | $260,700 |
| 2021 | $2,304 | $312,800 | $103,800 | $209,000 |
| 2020 | $2,129 | $273,200 | $103,800 | $169,400 |
| 2019 | $2,093 | $260,900 | $97,900 | $163,000 |
| 2018 | $1,996 | $240,200 | $97,900 | $142,300 |
| 2017 | $1,784 | $226,000 | $97,900 | $128,100 |
| 2016 | $1,560 | $196,300 | $97,900 | $98,400 |
| 2015 | $1,628 | $190,600 | $93,800 | $96,800 |
| 2014 | $1,597 | $183,400 | $90,900 | $92,500 |
Source: Public Records
Map
Nearby Homes
- 6398 S Lobelia Dr
- 6437 S Lobelia Dr
- 4909 Sakura Ct
- 5071 W Jarrad Rd
- 6635 S Milfoil Cir
- 6160 S Miramonte Way Unit T-30
- 6568 S 5180 W
- 6157 S Impressions Dr
- 4692 W Talavera Way
- 6022 S Park Wood Dr W
- 4690 W Miramonte Way #15 Way
- 6706 Marshrock Rd
- 5183 W Cadenza Dr
- 5960 S Tumerick Ct
- 6489 S Daffodil Way
- 5275 Ridge Flower Way
- 5352 Cassatt Cir
- 4790 W Barletta Ct
- 5285 Ridge Flower Way
- 4983 Shooting Star Ave
- 4959 Pawnee Dr
- 6360 Moki Cir
- 6348 Moki Cir
- 6341 Hopi Cir
- 6353 S Hopi Cir
- 6353 Hopi Cir
- 4967 Pawnee Dr
- 4967 W Pawnee Dr
- 6327 S Hopi Cir
- 6327 Hopi Cir
- 6366 Moki Cir
- 6366 S Moki Cir
- 6363 S Hopi Cir
- 4973 Pawnee Dr
- 6351 S Moki Cir
- 6363 Hopi Cir
- 6369 Moki Cir
- 6369 S Moki Cir
- 6361 S Moki Cir
- 4946 Pawnee Dr