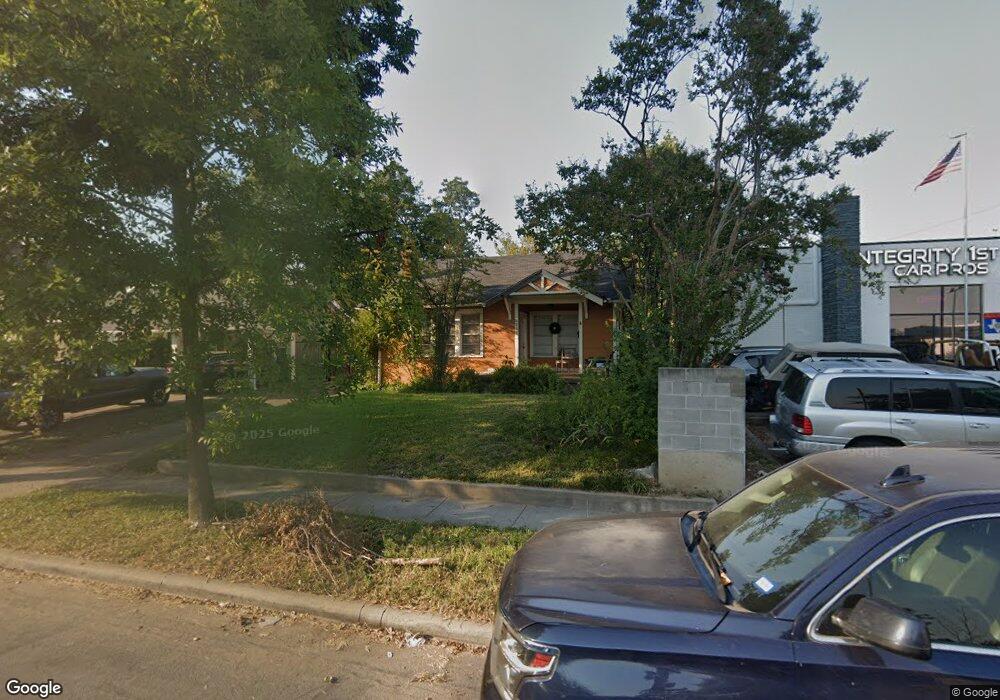
6355 Belmont Ave Dallas, TX 75214
Lakewood NeighborhoodEstimated Value: $597,000 - $656,000
3
Beds
2
Baths
1,465
Sq Ft
$421/Sq Ft
Est. Value
About This Home
This home is located at 6355 Belmont Ave, Dallas, TX 75214 and is currently estimated at $616,927, approximately $421 per square foot. 6355 Belmont Ave is a home located in Dallas County with nearby schools including J L Long Middle School, Woodrow Wilson High School, and St Thomas Aquinas Catholic School.
Ownership History
Date
Name
Owned For
Owner Type
Purchase Details
Closed on
Oct 24, 2016
Sold by
Mezger Robert
Bought by
Mezger Janet D and Mezger Janet Divinagracia
Current Estimated Value
Home Financials for this Owner
Home Financials are based on the most recent Mortgage that was taken out on this home.
Original Mortgage
$127,150
Outstanding Balance
$101,999
Interest Rate
3.48%
Mortgage Type
New Conventional
Estimated Equity
$514,928
Purchase Details
Closed on
Jan 22, 2009
Sold by
Federal Home Loan Mortgage Corporation
Bought by
Mezger Robert W and Mezger Janet D
Home Financials for this Owner
Home Financials are based on the most recent Mortgage that was taken out on this home.
Original Mortgage
$149,343
Interest Rate
4.91%
Mortgage Type
FHA
Purchase Details
Closed on
Jan 29, 1999
Sold by
Small Melba Lynn
Bought by
Harper Troy Franklin
Purchase Details
Closed on
Nov 20, 1996
Sold by
Small Melba Lynn and Small Troy Lee
Bought by
Small Melba Lynn
Create a Home Valuation Report for This Property
The Home Valuation Report is an in-depth analysis detailing your home's value as well as a comparison with similar homes in the area
Home Values in the Area
Average Home Value in this Area
Purchase History
| Date | Buyer | Sale Price | Title Company |
|---|---|---|---|
| Mezger Janet D | -- | Lawyers Title | |
| Mezger Robert W | -- | Chicago Title Servicelink Br | |
| Harper Troy Franklin | -- | -- | |
| Small Melba Lynn | -- | -- |
Source: Public Records
Mortgage History
| Date | Status | Borrower | Loan Amount |
|---|---|---|---|
| Open | Mezger Janet D | $127,150 | |
| Closed | Mezger Robert W | $149,343 |
Source: Public Records
Tax History Compared to Growth
Tax History
| Year | Tax Paid | Tax Assessment Tax Assessment Total Assessment is a certain percentage of the fair market value that is determined by local assessors to be the total taxable value of land and additions on the property. | Land | Improvement |
|---|---|---|---|---|
| 2025 | $6,769 | $534,000 | $405,000 | $129,000 |
| 2024 | $6,769 | $516,420 | $405,000 | $111,420 |
| 2023 | $6,769 | $483,060 | $405,000 | $78,060 |
| 2022 | $6,757 | $340,000 | $270,000 | $70,000 |
| 2021 | $6,740 | $335,280 | $270,000 | $65,280 |
| 2020 | $7,781 | $286,800 | $236,250 | $50,550 |
| 2019 | $8,160 | $286,800 | $236,250 | $50,550 |
| 2018 | $7,799 | $286,800 | $236,250 | $50,550 |
| 2017 | $6,727 | $247,380 | $202,500 | $44,880 |
| 2016 | $6,727 | $247,380 | $202,500 | $44,880 |
| 2015 | $3,755 | $221,460 | $182,250 | $39,210 |
| 2014 | $3,755 | $221,460 | $182,250 | $39,210 |
Source: Public Records
Map
Nearby Homes
- 6402 Lakewood Blvd
- 6333 Richmond Ave Unit D
- 6329 Richmond Ave
- 6318 Richmond Ave Unit 4202D
- 6318 Richmond Ave Unit 4203D
- 6326 Lakeshore Dr
- 6303 Prospect Ave Unit B104
- 6254 Goliad Ave
- 6244 Richmond Ave
- 6234 Lakeshore Dr
- 6334 Velasco Ave
- 6246 Prospect Ave
- 6218 Lakeshore Dr
- 6227 Lakeshore Dr
- 6339 Velasco Ave
- 6235 Palo Pinto Ave
- 6166 Belmont Ave
- 6630 Lakewood Blvd
- 6248 Oram St Unit 6
- 1914 La Croix Place
- 6351 Belmont Ave
- 6359 Belmont Ave
- 6349 Belmont Ave
- 6347 Belmont Ave
- 6345 Belmont Ave
- 6354 Goliad Ave
- 6348 Goliad Ave
- 6348 Goliad Ave Unit garage
- 6354 Belmont Ave
- 6346 Goliad Ave
- 6350 Belmont Ave
- 6350 Goliad Ave
- 6344 Goliad Ave
- 6343 Belmont Ave
- 6348 Belmont Ave
- 6342 Goliad Ave
- 6342 Belmont Ave
- 6335 Belmont Ave
- 6338 Goliad Ave
- 6338 Belmont Ave