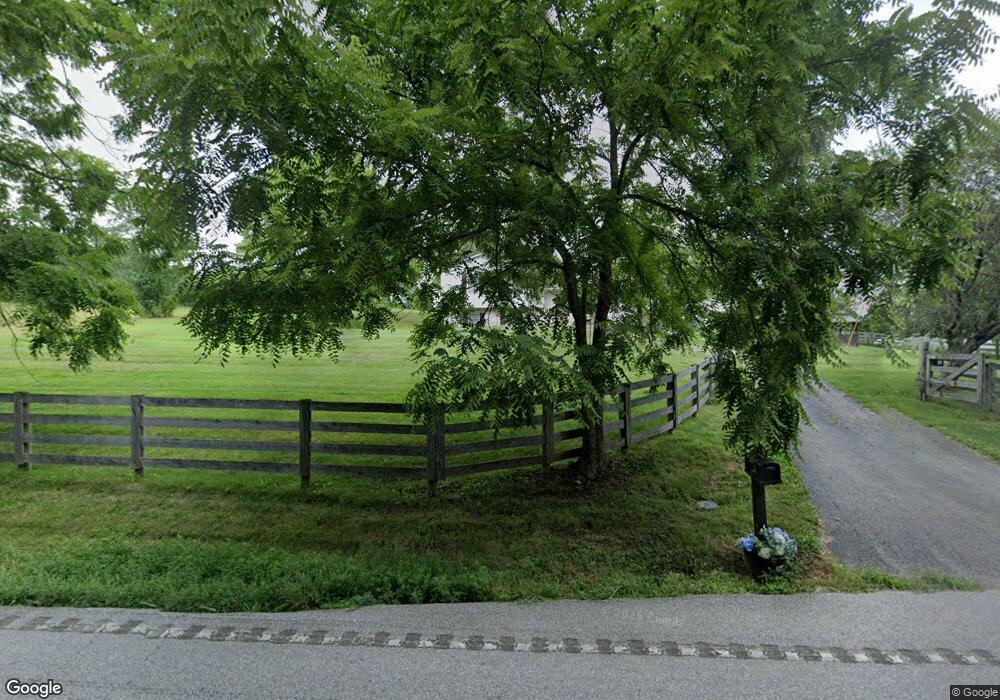
6355 Kentucky 16 Warsaw, KY 41095
Estimated Value: $282,000 - $384,000
3
Beds
3
Baths
2,028
Sq Ft
$168/Sq Ft
Est. Value
About This Home
This home is located at 6355 Kentucky 16, Warsaw, KY 41095 and is currently estimated at $340,019, approximately $167 per square foot. 6355 Kentucky 16 is a home located in Gallatin County with nearby schools including Gallatin County Lower Elementary School, Gallatin County Upper Elementary School, and Gallatin County Middle School.
Ownership History
Date
Name
Owned For
Owner Type
Purchase Details
Closed on
Jul 27, 2023
Sold by
Kinmon Kennedy Michelle
Bought by
Kinmon Heath Gregory
Current Estimated Value
Purchase Details
Closed on
Mar 13, 2020
Sold by
Stephen Jones
Bought by
Kinmon Heath
Home Financials for this Owner
Home Financials are based on the most recent Mortgage that was taken out on this home.
Original Mortgage
$218,500
Interest Rate
3.4%
Mortgage Type
New Conventional
Purchase Details
Closed on
Mar 10, 2014
Sold by
Gary Gary and Lewis Tammy L
Bought by
Cozine Eddie and Cozine Patty
Purchase Details
Closed on
Oct 31, 2012
Sold by
Brewer Paul W and Brewer Shirley
Bought by
Jones Stephen C and Jones Angela M
Home Financials for this Owner
Home Financials are based on the most recent Mortgage that was taken out on this home.
Original Mortgage
$162,993
Interest Rate
3.4%
Mortgage Type
FHA
Create a Home Valuation Report for This Property
The Home Valuation Report is an in-depth analysis detailing your home's value as well as a comparison with similar homes in the area
Home Values in the Area
Average Home Value in this Area
Purchase History
| Date | Buyer | Sale Price | Title Company |
|---|---|---|---|
| Kinmon Heath Gregory | -- | None Listed On Document | |
| Kinmon Heath | $230,000 | -- | |
| Kinmon Heath | $230,000 | Priority National Title | |
| Cozine Eddie | $140,661 | -- | |
| Jones Stephen C | $166,000 | -- |
Source: Public Records
Mortgage History
| Date | Status | Borrower | Loan Amount |
|---|---|---|---|
| Previous Owner | Kinmon Heath | $218,500 | |
| Previous Owner | Jones Stephen C | $162,993 |
Source: Public Records
Tax History Compared to Growth
Tax History
| Year | Tax Paid | Tax Assessment Tax Assessment Total Assessment is a certain percentage of the fair market value that is determined by local assessors to be the total taxable value of land and additions on the property. | Land | Improvement |
|---|---|---|---|---|
| 2024 | $2,447 | $230,000 | $30,000 | $200,000 |
| 2023 | $2,466 | $230,000 | $30,000 | $200,000 |
| 2022 | $2,475 | $230,000 | $30,000 | $200,000 |
| 2021 | $2,493 | $230,000 | $30,000 | $200,000 |
| 2020 | $2,553 | $0 | $0 | $0 |
| 2019 | $2,196 | $196,700 | $40,000 | $156,700 |
| 2018 | $2,197 | $196,700 | $40,000 | $156,700 |
| 2017 | $2,197 | $213,400 | $40,000 | $173,400 |
| 2016 | -- | $166,000 | $40,000 | $126,000 |
| 2014 | $1,410 | $166,000 | $40,000 | $126,000 |
| 2011 | $1,410 | $160,900 | $40,000 | $120,900 |
Source: Public Records
Map
Nearby Homes
- 0 Little Sugar Creek Rd
- 153 Willow Pointe Dr
- 155 Willow Pointe Dr
- 1750 Walnut Lick Rd
- 130 Willow Pointe Dr
- 500 Timberline Rd
- 3610 Highway 2850
- 1870 Tapering Pointe Rd
- 2525 Ky Hwy 2850
- 138 Southridge Dr
- 120 Hwy 127
- 115 Patricia Ct
- 3172 Monticello Way
- 14838 Brown Rd
- 1112 Mehryn Way
- 1116 Mehryn Way
- 3270 Ballantree Way
- 220 Old Eagle Tunnel Rd
- 0 Kentucky 1992
- 1780 Ky Highway 16
- 6355 Ky Highway 16
- 6286 Ky Highway 16
- 6375 Ky Highway 16
- 6375 Ky Highway 16
- 625 Estates Ridge
- 6450 Ky Highway 16
- 6190 Ky Highway 16
- 6205 Ky Highway 16
- 6205 Kentucky 16
- 465 Wildwood Ct
- 6201 Ky Highway 16
- 6201 Ky Highway 16
- 240 Roberts Rd
- 280 Roberts Rd
- 6070 Ky Highway 16
- 6070 Ky Highway 16
- 464 Wildwood Ct
- 355 Wildwood Ct
- 2168 Roberts Rd
- 400 Estates Ridge