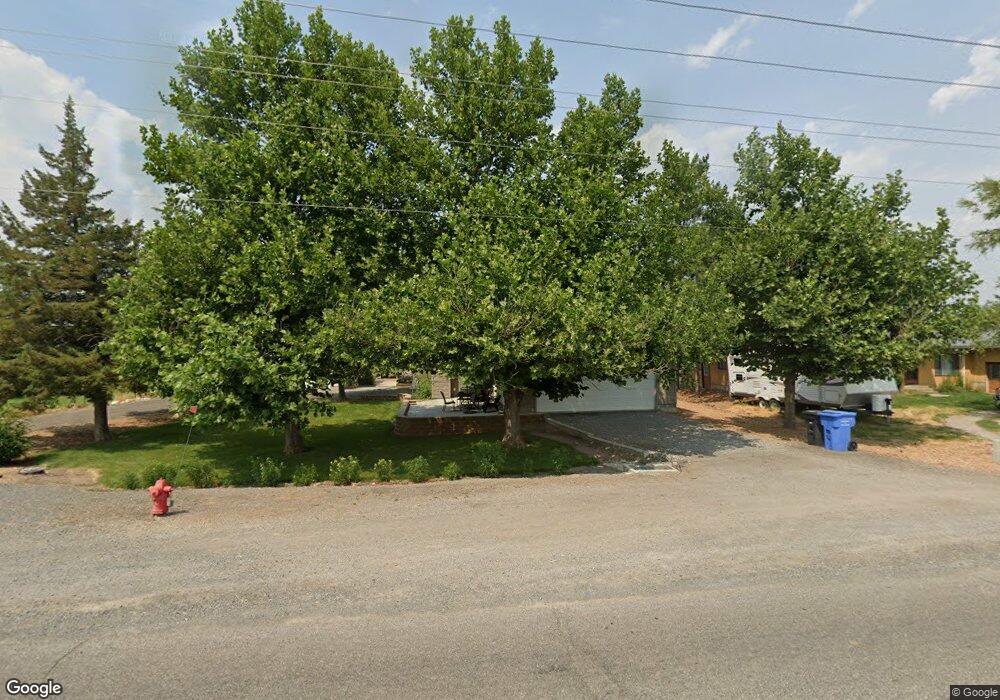
6355 N 2400 W Smithfield, UT 84335
Estimated Value: $737,816 - $1,066,000
Studio
--
Bath
2,367
Sq Ft
$365/Sq Ft
Est. Value
About This Home
This home is located at 6355 N 2400 W, Smithfield, UT 84335 and is currently estimated at $864,454, approximately $365 per square foot. 6355 N 2400 W is a home with nearby schools including Birch Creek School, Cedar Ridge School, and North Cache Middle School.
Ownership History
Date
Name
Owned For
Owner Type
Purchase Details
Closed on
Dec 15, 2022
Sold by
Sanders Richard D
Bought by
Richard D Sanders Living Trust
Current Estimated Value
Create a Home Valuation Report for This Property
The Home Valuation Report is an in-depth analysis detailing your home's value as well as a comparison with similar homes in the area
Purchase History
| Date | Buyer | Sale Price | Title Company |
|---|---|---|---|
| Richard D Sanders Living Trust | -- | -- |
Source: Public Records
Tax History
| Year | Tax Paid | Tax Assessment Tax Assessment Total Assessment is a certain percentage of the fair market value that is determined by local assessors to be the total taxable value of land and additions on the property. | Land | Improvement |
|---|---|---|---|---|
| 2025 | $3,051 | $466,700 | $0 | $0 |
| 2024 | $3,314 | $471,845 | $0 | $0 |
| 2023 | $2,989 | $393,765 | $0 | $0 |
| 2022 | $3,117 | $393,765 | $0 | $0 |
| 2021 | $2,149 | $417,163 | $74,200 | $342,963 |
| 2020 | $2,037 | $372,781 | $74,200 | $298,581 |
| 2019 | $1,992 | $344,481 | $45,900 | $298,581 |
| 2018 | $1,875 | $312,780 | $45,900 | $266,880 |
| 2017 | $1,874 | $166,730 | $0 | $0 |
| 2016 | $1,891 | $130,535 | $0 | $0 |
| 2015 | $1,197 | $105,835 | $0 | $0 |
| 2014 | $1,245 | $113,260 | $0 | $0 |
| 2013 | -- | $113,260 | $0 | $0 |
Source: Public Records
Map
Nearby Homes
Your Personal Tour Guide
Ask me questions while you tour the home.