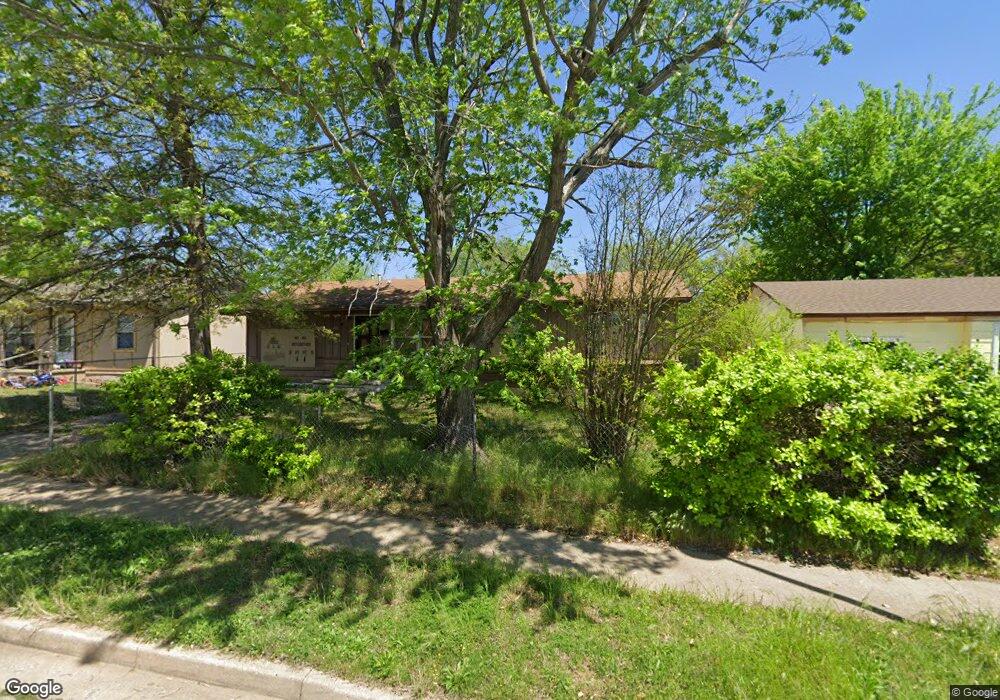
6355 N Boulder Ave Tulsa, OK 74126
Turley NeighborhoodEstimated Value: $70,000 - $109,771
2
Beds
1
Bath
1,464
Sq Ft
$64/Sq Ft
Est. Value
About This Home
This home is located at 6355 N Boulder Ave, Tulsa, OK 74126 and is currently estimated at $94,193, approximately $64 per square foot. 6355 N Boulder Ave is a home located in Tulsa County with nearby schools including Monroe Demonstration Academy, McLain High School of Science and Technology, and Tulsa Legacy Charter School.
Ownership History
Date
Name
Owned For
Owner Type
Purchase Details
Closed on
Oct 12, 2023
Sold by
Moreira Moeira Elvin
Bought by
Maldonado Fabiola Avila and Avila Valarie Michelle
Current Estimated Value
Purchase Details
Closed on
Mar 20, 2018
Sold by
Perra Carlos
Bought by
Meiera Elvw Moreina
Purchase Details
Closed on
Feb 26, 2018
Sold by
Neel Shelley and Neel Shelley
Bought by
Pereira Carlos
Purchase Details
Closed on
Jul 8, 2016
Sold by
Jp Investments
Bought by
Neel Shelley L
Home Financials for this Owner
Home Financials are based on the most recent Mortgage that was taken out on this home.
Original Mortgage
$6,000
Interest Rate
3.64%
Mortgage Type
Seller Take Back
Purchase Details
Closed on
Jun 17, 2014
Sold by
County Of Tulsa
Bought by
Tulsa County Board Of County Commissione
Create a Home Valuation Report for This Property
The Home Valuation Report is an in-depth analysis detailing your home's value as well as a comparison with similar homes in the area
Home Values in the Area
Average Home Value in this Area
Purchase History
| Date | Buyer | Sale Price | Title Company |
|---|---|---|---|
| Maldonado Fabiola Avila | $12,500 | None Listed On Document | |
| Meiera Elvw Moreina | -- | None Available | |
| Pereira Carlos | $1,000 | None Available | |
| Neel Shelley L | $3,000 | None Available | |
| Neel Shelley | $1,500 | None Available | |
| Tulsa County Board Of County Commissione | -- | None Available |
Source: Public Records
Mortgage History
| Date | Status | Borrower | Loan Amount |
|---|---|---|---|
| Previous Owner | Neel Shelley L | $6,000 |
Source: Public Records
Tax History
| Year | Tax Paid | Tax Assessment Tax Assessment Total Assessment is a certain percentage of the fair market value that is determined by local assessors to be the total taxable value of land and additions on the property. | Land | Improvement |
|---|---|---|---|---|
| 2025 | $545 | $4,066 | $626 | $3,440 |
| 2024 | $469 | $3,872 | $715 | $3,157 |
| 2023 | $469 | $3,696 | $682 | $3,014 |
| 2022 | $469 | $3,520 | $715 | $2,805 |
| 2021 | $465 | $3,520 | $715 | $2,805 |
| 2020 | $459 | $3,520 | $715 | $2,805 |
| 2019 | $482 | $3,520 | $715 | $2,805 |
| 2018 | $491 | $3,575 | $715 | $2,860 |
| 2017 | $490 | $3,575 | $715 | $2,860 |
| 2016 | $487 | $3,630 | $715 | $2,915 |
| 2015 | $488 | $3,630 | $715 | $2,915 |
| 2014 | $429 | $4,224 | $715 | $3,509 |
Source: Public Records
Map
Nearby Homes
- 6365 N Denver Ave
- 6340 N Denver Ave
- 320 W 63rd Place N
- 6111 N Cheyenne Ave
- 5608 N Garrison Ave
- 1898 Tulsa Mountain Ranch Rd
- 557 E 59th St N
- 7487 N Oakcliff Dr
- 552 E 55th Place N
- 5439 N Frankfort Ave
- 5462 N Hartford Ave
- 241 E 53rd St N
- 5806 N Madison Ave
- 5512 N Hartford Place
- 414 E 54th St N
- 1206 E 60th Place N
- 274 E 53rd St N
- 6735 N Peoria Ave
- 5492 N Peoria Ave
- 5462 N Johnstown Ave
- 6351 N Boulder Ave
- 6361 N Boulder Ave
- 6356 N Main St
- 6345 N Boulder Ave
- 6365 N Boulder Ave
- 6362 N Main St
- 6352 N Main St
- 6366 N Main St
- 6346 N Main St
- 6356 N Boulder Ave
- 6369 N Boulder Ave
- 6341 N Boulder Ave
- 6352 N Boulder Ave
- 6360 N Boulder Ave
- 6366 N Boulder Ave
- 6346 N Boulder Ave
- 6370 N Main St
- 6342 N Main St
- 6375 N Boulder Ave
- 6337 N Boulder Ave
Your Personal Tour Guide
Ask me questions while you tour the home.