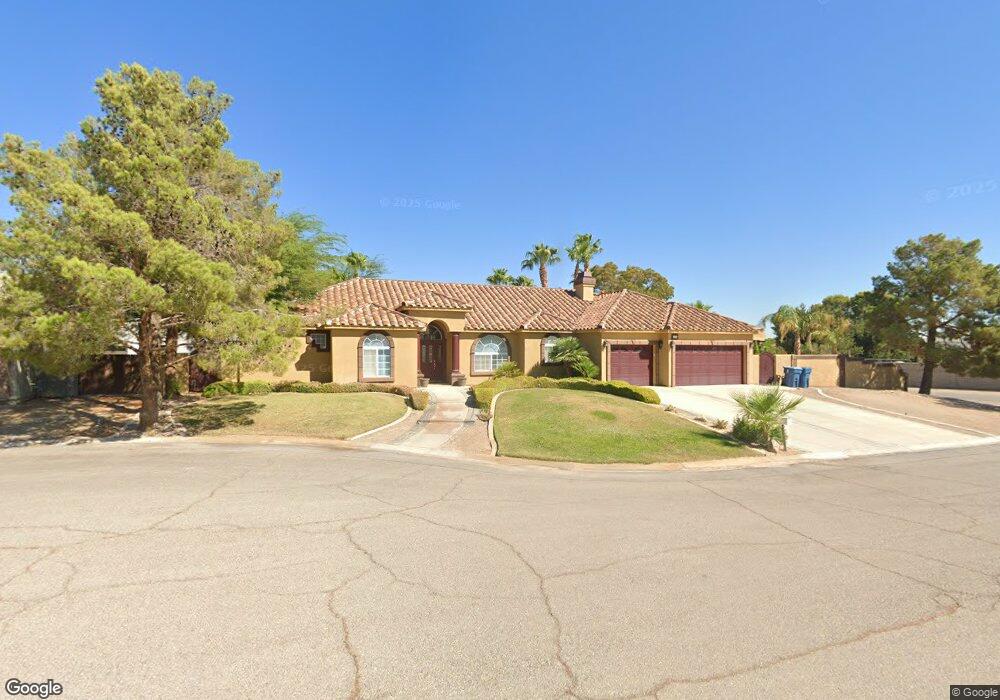
6355 Westwind Rd Las Vegas, NV 89118
Estimated Value: $821,000 - $1,091,000
3
Beds
3
Baths
2,777
Sq Ft
$337/Sq Ft
Est. Value
About This Home
This home is located at 6355 Westwind Rd, Las Vegas, NV 89118 and is currently estimated at $934,799, approximately $336 per square foot. 6355 Westwind Rd is a home located in Clark County with nearby schools including Helen Jydstrup Elementary School, Grant Sawyer Middle School, and Durango High School.
Ownership History
Date
Name
Owned For
Owner Type
Purchase Details
Closed on
Jun 19, 2017
Sold by
Walsh Richard M
Bought by
Walsh Richard M and Walsh Family Trust
Current Estimated Value
Purchase Details
Closed on
Jun 30, 2000
Sold by
Walsh Kelle Bishop
Bought by
Walsh Richard M
Home Financials for this Owner
Home Financials are based on the most recent Mortgage that was taken out on this home.
Original Mortgage
$200,000
Outstanding Balance
$72,565
Interest Rate
8.63%
Estimated Equity
$862,234
Purchase Details
Closed on
Jun 3, 2000
Sold by
Canella Peters Carolyn and Peters Carolyn
Bought by
Walsh Richard M
Home Financials for this Owner
Home Financials are based on the most recent Mortgage that was taken out on this home.
Original Mortgage
$200,000
Outstanding Balance
$72,565
Interest Rate
8.63%
Estimated Equity
$862,234
Purchase Details
Closed on
Sep 3, 1999
Sold by
Peters Dwight
Bought by
Peters Carolyn
Create a Home Valuation Report for This Property
The Home Valuation Report is an in-depth analysis detailing your home's value as well as a comparison with similar homes in the area
Home Values in the Area
Average Home Value in this Area
Purchase History
| Date | Buyer | Sale Price | Title Company |
|---|---|---|---|
| Walsh Richard M | -- | None Available | |
| Walsh Richard M | -- | Old Republic Title Company | |
| Walsh Richard M | $271,950 | Old Republic Title Company | |
| Peters Carolyn | -- | -- |
Source: Public Records
Mortgage History
| Date | Status | Borrower | Loan Amount |
|---|---|---|---|
| Open | Walsh Richard M | $200,000 |
Source: Public Records
Tax History Compared to Growth
Tax History
| Year | Tax Paid | Tax Assessment Tax Assessment Total Assessment is a certain percentage of the fair market value that is determined by local assessors to be the total taxable value of land and additions on the property. | Land | Improvement |
|---|---|---|---|---|
| 2025 | $3,757 | $204,569 | $73,500 | $131,069 |
| 2024 | $3,648 | $204,569 | $73,500 | $131,069 |
| 2023 | $3,648 | $185,143 | $61,250 | $123,893 |
| 2022 | $3,542 | $167,969 | $54,250 | $113,719 |
| 2021 | $3,439 | $157,987 | $49,000 | $108,987 |
| 2020 | $3,336 | $157,458 | $49,000 | $108,458 |
| 2019 | $3,239 | $150,924 | $43,750 | $107,174 |
| 2018 | $3,144 | $143,970 | $40,250 | $103,720 |
| 2017 | $4,120 | $140,469 | $35,000 | $105,469 |
| 2016 | $2,977 | $131,788 | $28,000 | $103,788 |
| 2015 | $2,972 | $102,906 | $26,250 | $76,656 |
| 2014 | $2,885 | $95,442 | $17,500 | $77,942 |
Source: Public Records
Map
Nearby Homes
- 5875 W Post Rd
- 5801 Exbury Gardens Ct
- 5880 W Post Rd
- 6315 Bellisima St
- 0 Woodstock
- 5829 W Patrick Ln
- 0 Unit 2701179
- 0 S Lindell Rd
- 0 W Patrick Ln Unit 2675444
- 0 W Patrick Ln Unit 2718906
- 5910 W Post Rd
- 5332 Avory Peak Ct
- 5990 Viscaya Grove St
- 5790 Westwind Rd
- 0 Mohawk St Unit 2675414
- 6210 W Quail Ave
- 0 Badura Ave
- 0 W Unit 2633036
- 5770 El Camino Rd
- 5354 Silver Branch Ave
- 6365 Westwind Rd
- 6345 Westwind Rd
- 6385 Westwind Rd
- 5780 W Teco Ave
- 6335 S Westwind Rd
- 6375 Westwind Rd
- 5730 Exbury Gardens Ct
- 6315 Westwind Rd
- 5865 W Post Rd
- 5729 Exbury Gardens Ct
- 6325 Westwind Rd
- 5770 W Teco Ave
- 6326 Westwind Rd
- 6415 Westwind Rd
- 5760 W Teco Ave
- 6425 Westwind Rd
- 5855 W Post Rd
- 5763 W Post Rd
- 5595 W Teco Ave
- 5765 Exbury Gardens Ct